Diversity funnel metrics
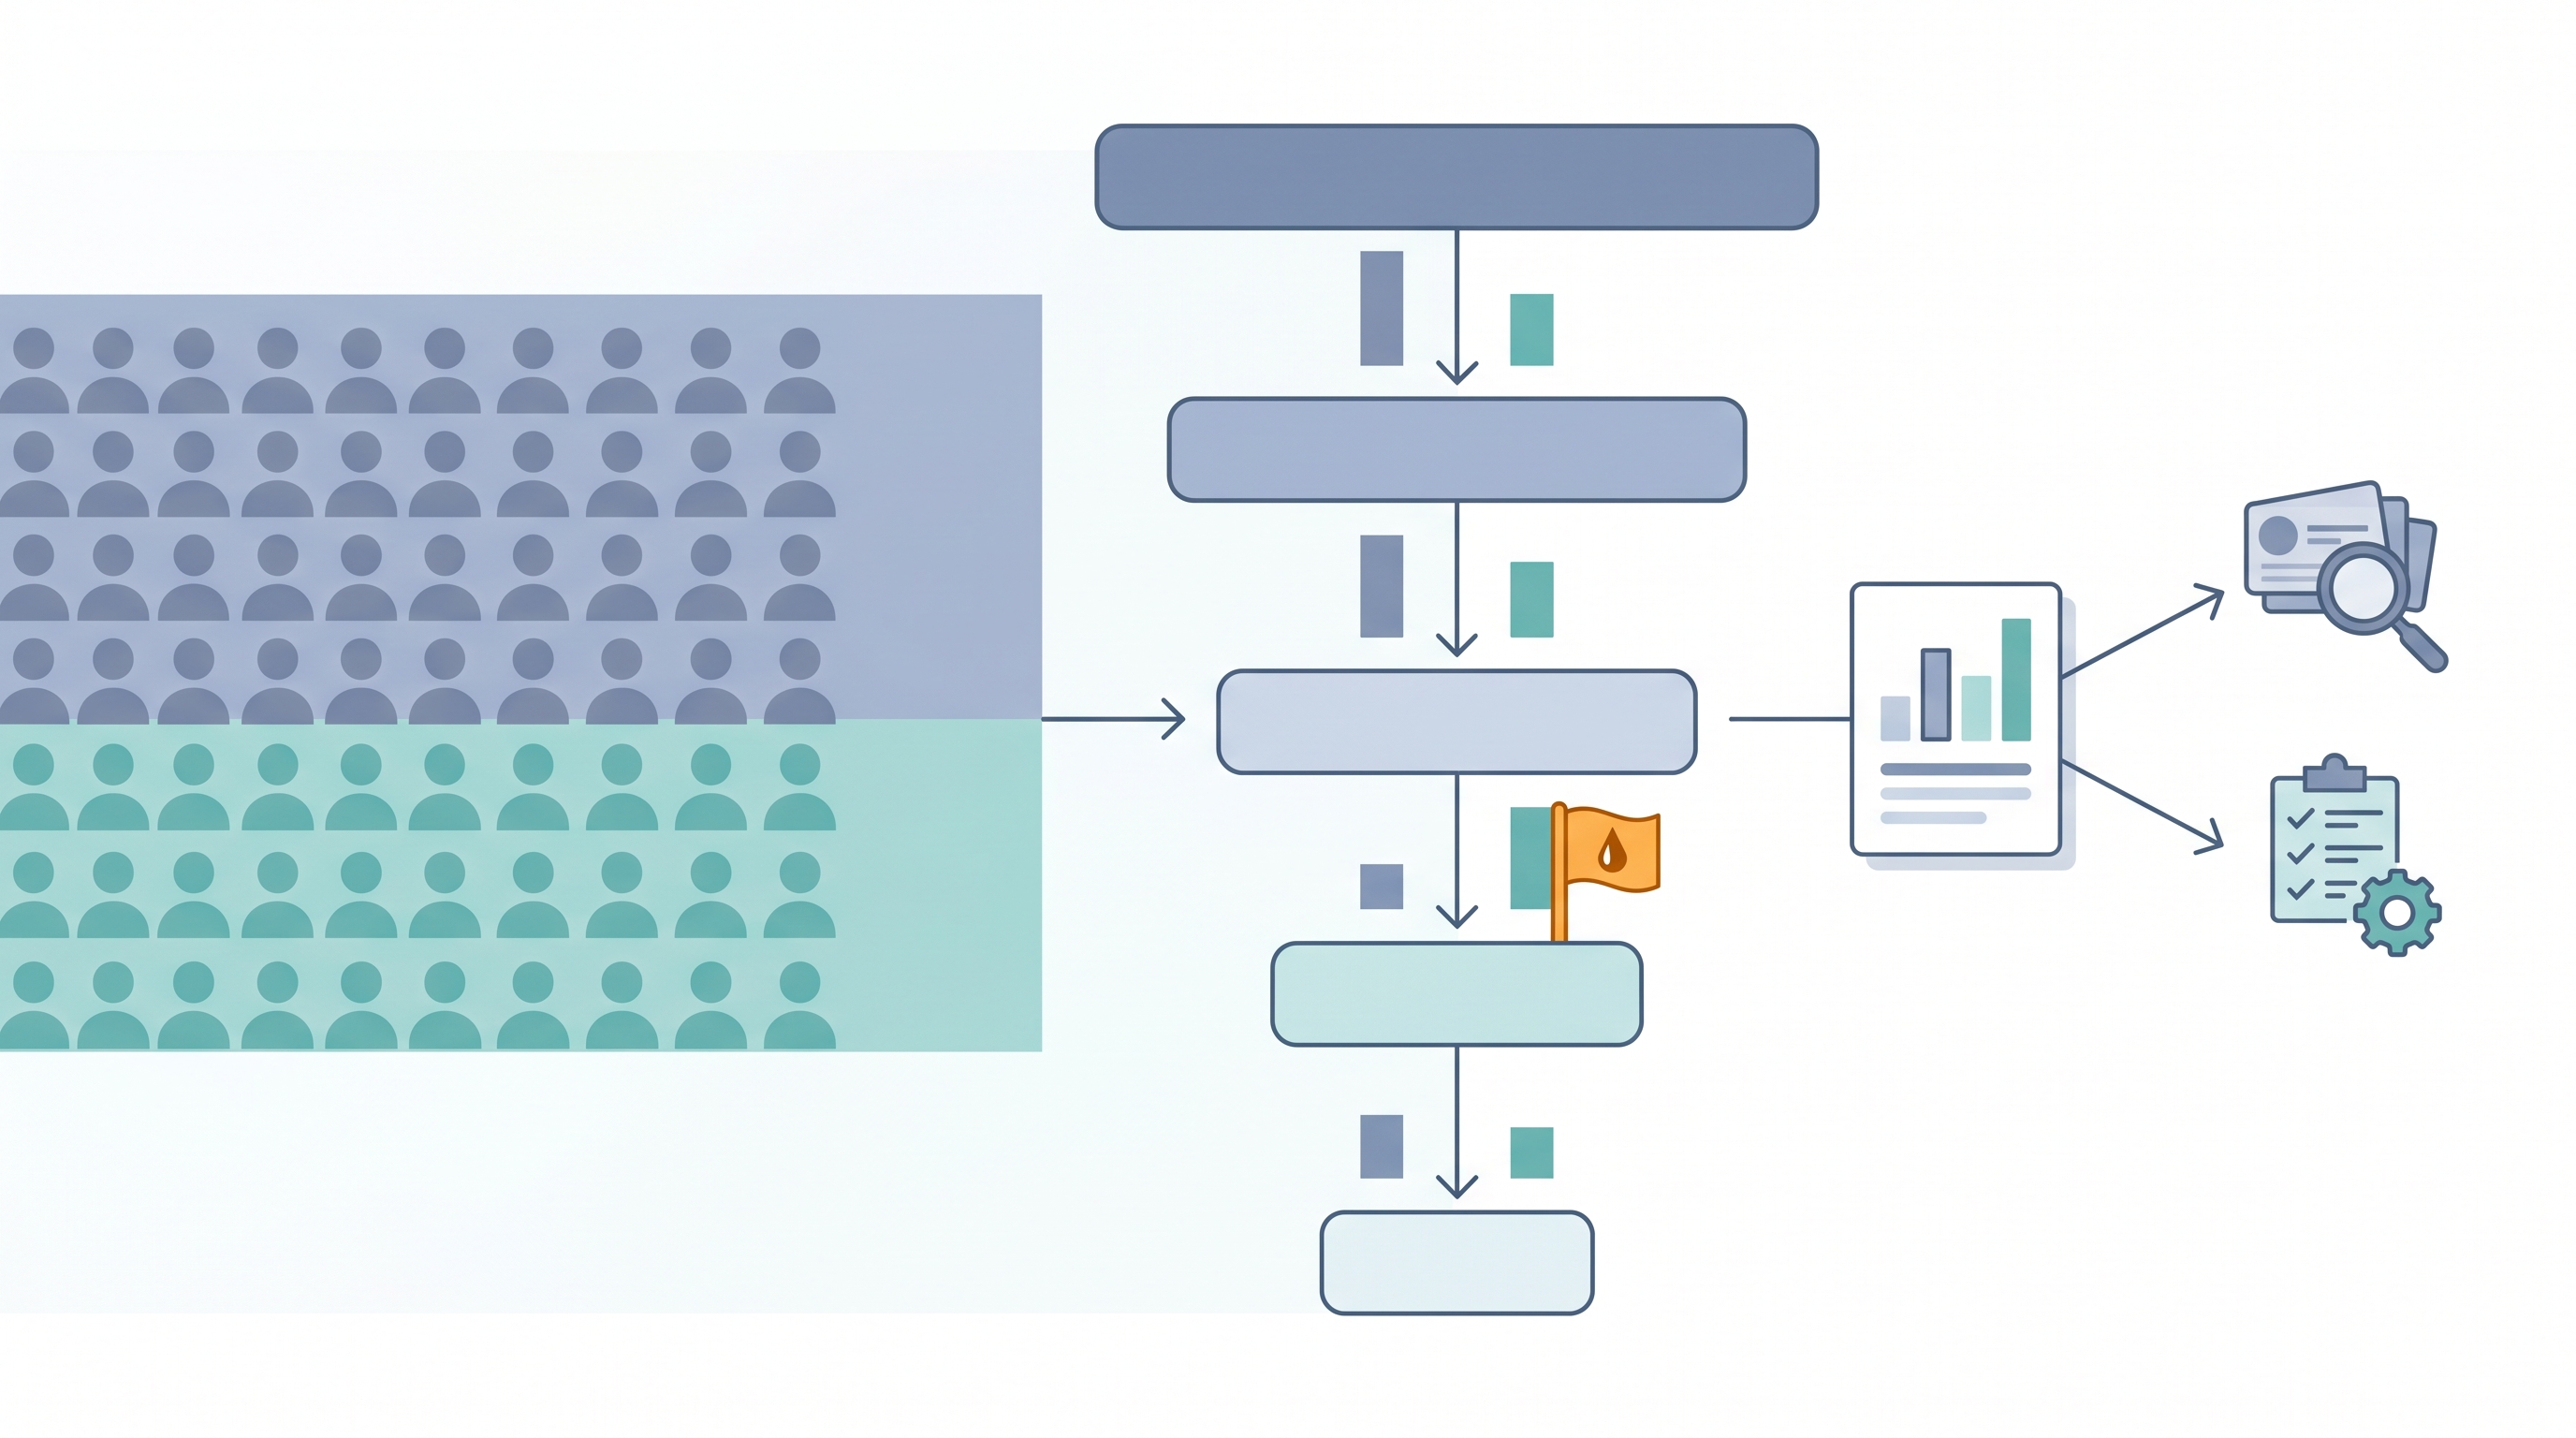
Stage-by-stage tracking of candidate representation by demographic group through the hiring pipeline, from sourced through offer accepted, so TA teams can see exactly where representation gaps emerge rather than discovering the problem only at the hire.
Michal Juhas · Last reviewed May 9, 2026
What is diversity funnel metrics?
Diversity funnel metrics track candidate representation by demographic group at each stage of the hiring pipeline. Unlike a simple diversity-at-hire count, they show where gaps open: whether underrepresented candidates drop off at sourcing, at the first screen, during the interview panel, or at the offer stage.
The distinction matters because the fix depends on the stage. A gap at sourcing calls for a different channel or search strategy. A gap at the hiring manager interview calls for rubric calibration and structured debrief. Without stage-level data, DEI programs guess at which intervention to run.
In practice
- A TA ops lead tracks gender representation across all stages and notices a sharp drop between phone screen and hiring manager submission. After reviewing disposition codes, the team finds that screen criteria were written to match the current team profile rather than validated job requirements. They rewrite the criteria and the gap closes in the next quarter.
- During an Recruiting OS session, a recruiter prompts an LLM with anonymized stage-conversion counts by group and asks it to identify the largest relative drop. The model flags the assessment stage, where a recently added vendor tool had not been audited for group-rate parity. The team pauses the tool pending a bias review.
- A DEI program manager asks "where in the process are we losing underrepresented candidates?" and the recruiter can point to a dashboard card rather than saying "I think it happens somewhere in screening."
Quick read, then how hiring teams use it
This is for recruiters, TA leaders, DEI partners, and HR business partners who need the same vocabulary in pipeline reviews, vendor evaluations, and legal audits. Skim the first section for shared context. Use the second when structuring the data extract or building an AI-assisted pattern review.
Plain-language summary
- What it means for you: Tracking representation at each stage tells you exactly where to intervene, not just what your hire mix looks like at the end.
- How you would use it: Count candidates entering and leaving each stage, split by demographic group, and note where the rate diverges from the earlier stage.
- How to get started: Export your ATS stage-decision log for the last quarter, add the EEO self-identification field, and build a stage-by-stage pass rate table in a spreadsheet before any tool is involved.
- When it is a good time: Any time your overall hire diversity is below target, or when a hiring manager or DEI partner asks why the pipeline looks different from the final hire cohort.
When you are running live reqs and tools
- What it means for you: Stage-level representation data is the audit trail that separates a well-run DEI program from a well-intentioned one. It shows process health, not just outcome luck.
- When it is a good time: Quarterly as a standing review, and immediately when a sourcing channel change or new assessment vendor is introduced that could shift group-rate patterns.
- How to use it: Pull the stage-decision log from your ATS, join EEO fields, and compute pass rates by group at each gate. Flag any stage where the ratio between groups drops noticeably from the prior stage. Cross-reference with adverse impact analysis for legal thresholds and with sourcing funnel metrics so the full pipeline story is consistent.
- How to get started: Choose one role family or department, run the analysis for the past two quarters, and present the stage-conversion table in a TA team meeting before scaling to the full hiring function.
- What to watch for: Low self-identification rates that make percentages unreliable; treat below 60 percent response rate as a data-quality flag. Also watch for a single large req with unusual demographics skewing the cohort and masking a real pattern in smaller req types.
Where we talk about this
On AI with Michal live sessions, diversity funnel metrics come up in the AI in recruiting track alongside compliance fundamentals. Sessions walk teams through how to structure the data extract, run the pass-rate calculation, and present findings to hiring managers without triggering defensiveness. If you want the full room conversation with real funnel data, start at Sourcing Lab and bring your ATS schema and one quarter of stage exports.
Around the web (opinions and rabbit holes)
Third-party creators move fast. Treat these as starting points, not endorsements, and double-check anything before wiring candidate data.
YouTube
- Search "diversity hiring funnel analysis" on the AIHR YouTube channel for practitioner walkthroughs of stage-level representation tracking and how to present findings to leadership.
- Search "DEI metrics hiring funnel" on LinkedIn Talent Solutions YouTube for how sourcing and screening stages affect representation outcomes and where drop-off is most common.
- Search "EEO data ATS analysis" on YouTube for step-by-step tutorials on exporting and computing group-rate pass rates from common ATS platforms without needing a data analyst.
- How do you track diversity metrics in your ATS? in r/humanresources has practitioner discussions on self-identification rates, field definitions, and what to do when your data is patchy.
- DEI hiring data in r/TalentAcquisition covers how TA ops teams structure quarterly diversity reporting and which metrics leadership actually acts on.
- Adverse impact and AI screening in r/recruiting connects diversity funnel concerns to the legal risk side, with real examples from recruiters running AI tools at scale.
Quora
- How do companies measure diversity in hiring? collects practitioner and DEI consultant perspectives on which stage-level metrics matter most and where to start when building a tracking program (read critically; quality varies).
Diversity funnel metrics versus related concepts
| Diversity funnel metrics | Adverse impact analysis | |
|---|---|---|
| Primary use | Identify which stage to fix | Assess legal exposure |
| Sample requirement | Useful as directional at small scale | Needs 40 or more per group |
| Who acts on it | TA, DEI, sourcing teams | Legal, HR leadership |
| Typical frequency | Monthly or quarterly review | Quarterly compliance run |
Related on this site
- Glossary: Adverse impact, Sourcing funnel metrics, Hiring funnel conversion rates, Scorecard, Explainable AI in hiring, Funnel drop-off analysis, AI bias audit
- Course: Starting with AI: the foundations in recruiting
- Live cohort: Sourcing Lab
- Membership: Become a member