Hiring funnel conversion rates
The percentage of candidates who advance from one hiring stage to the next, tracked at each transition from application through to offer acceptance.
Michal Juhas · Last reviewed May 5, 2026
What is hiring funnel conversion rate?
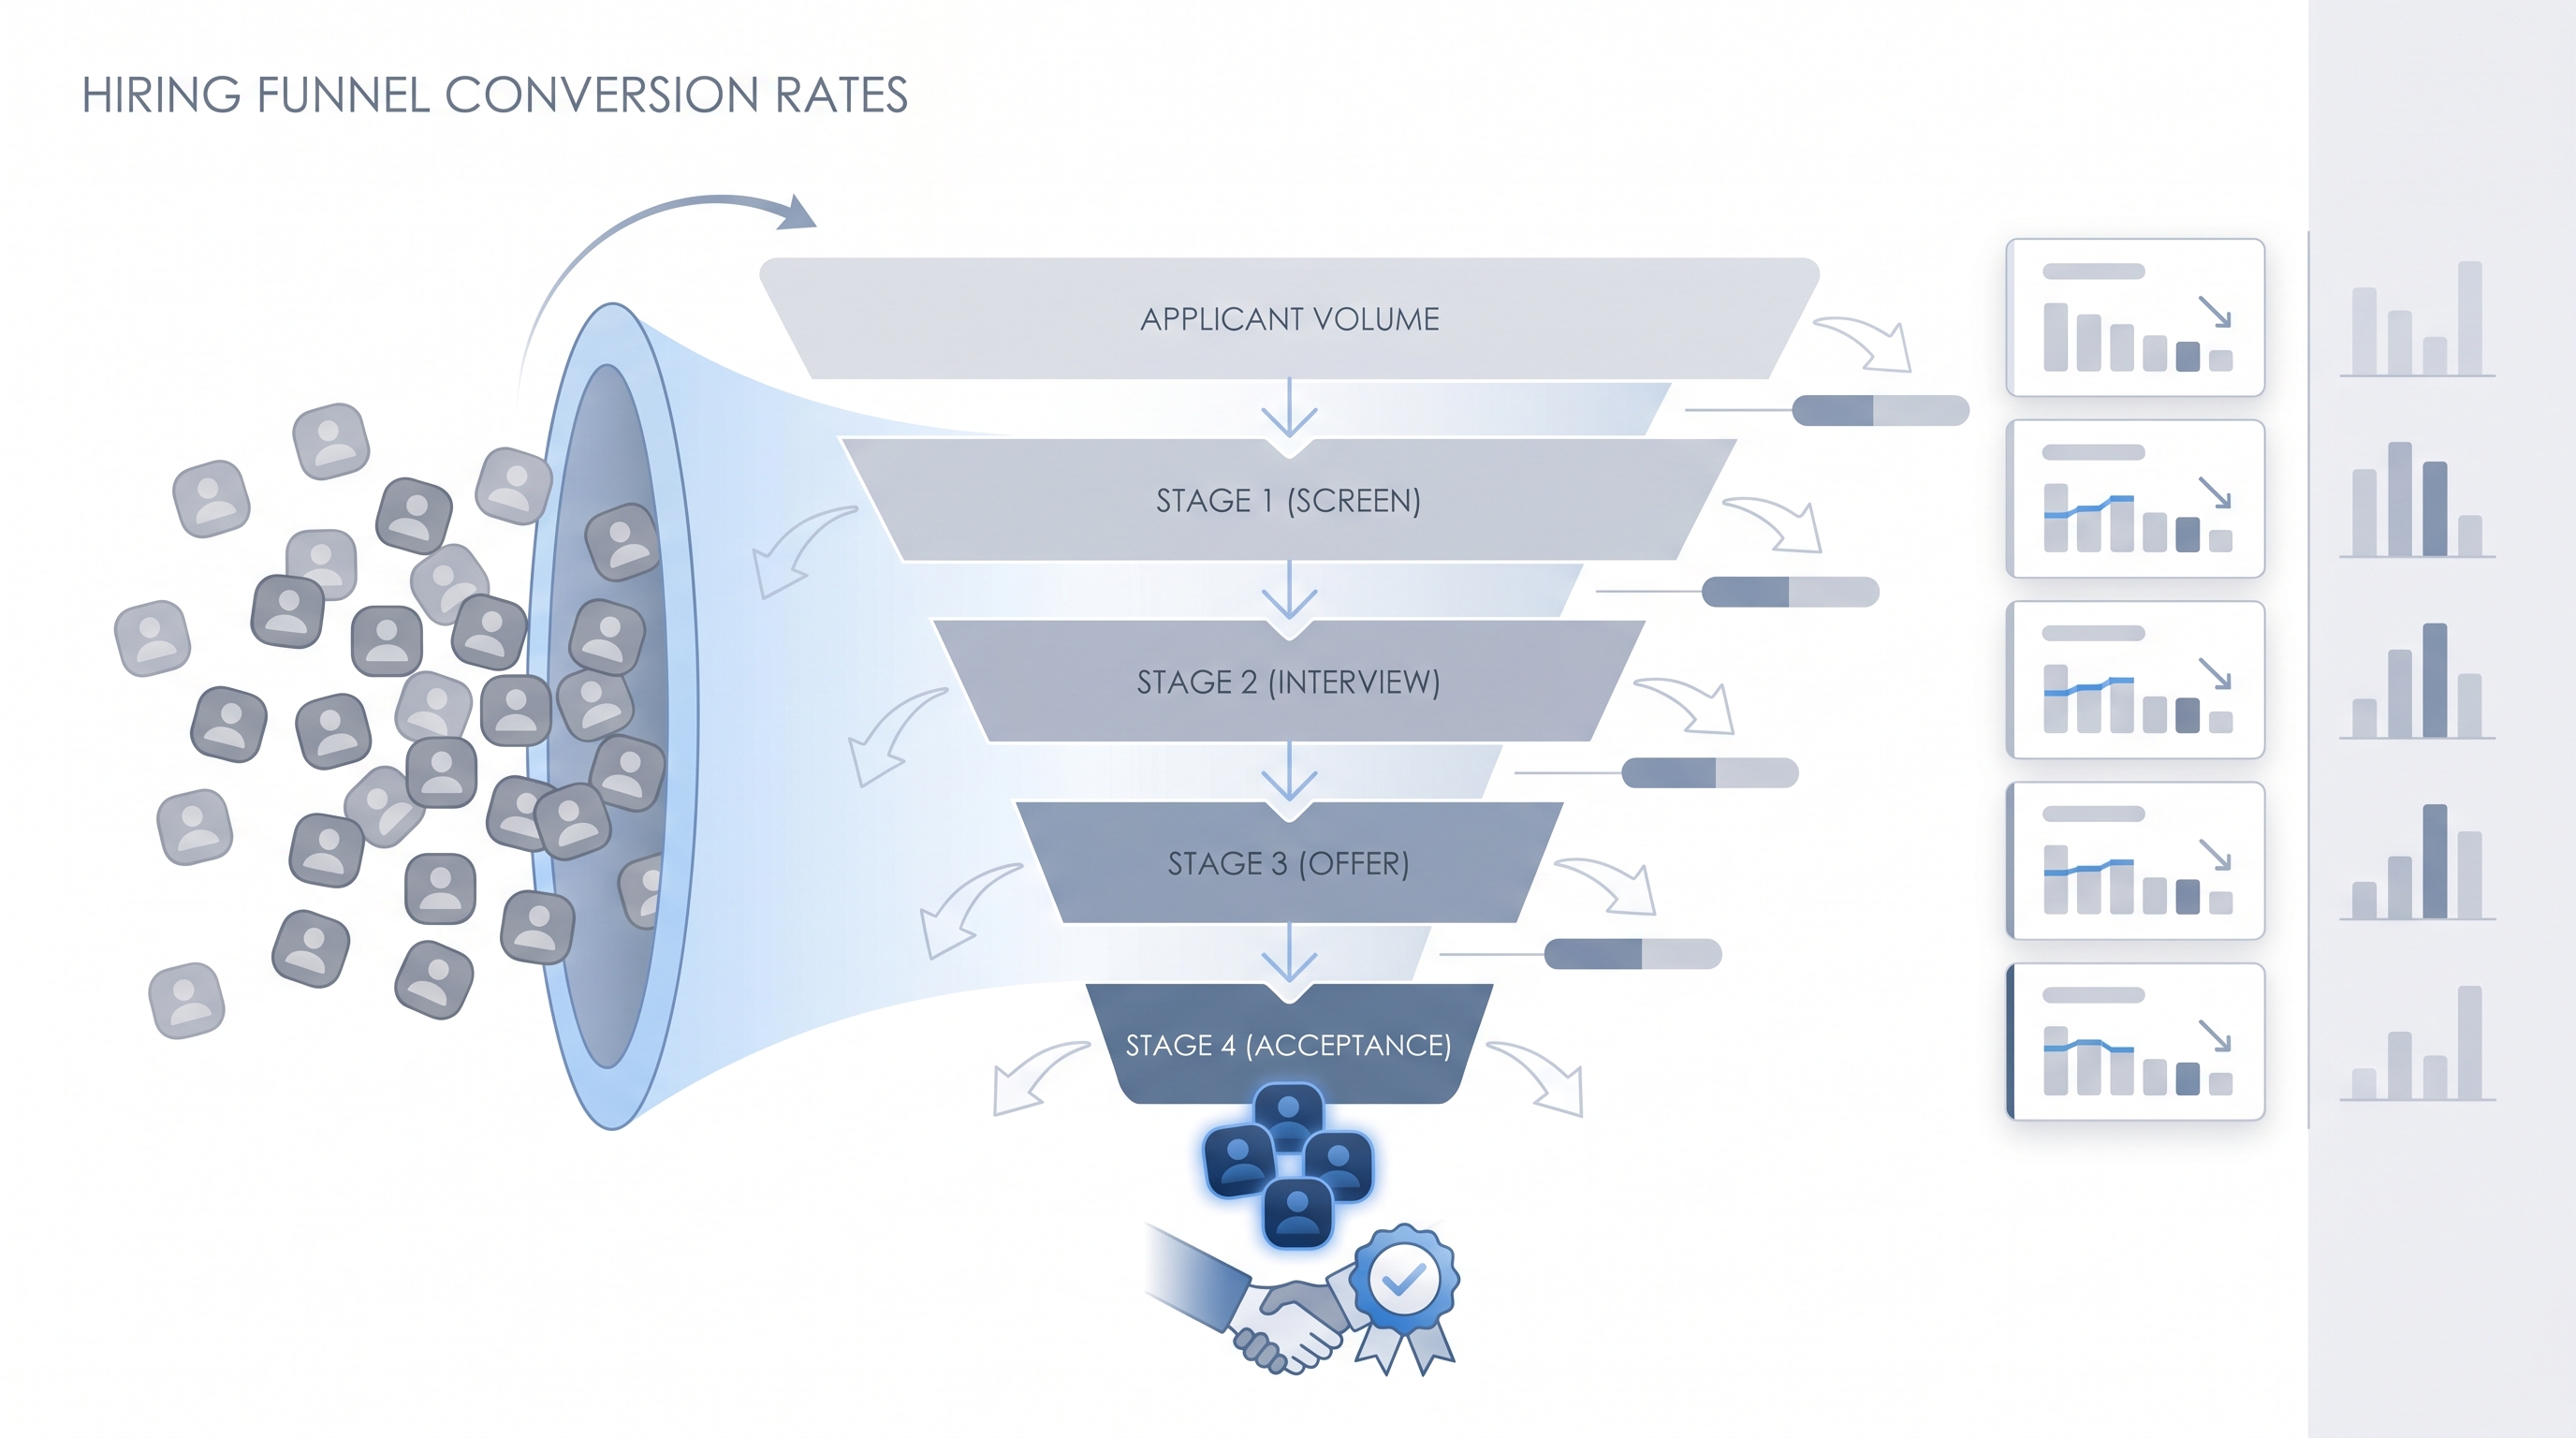
A hiring funnel conversion rate is the percentage of candidates who progress from one stage of the hiring pipeline to the next. Every process has a shape: most candidates enter at the top (application) and far fewer reach the bottom (offer acceptance). Measuring each step individually tells you more than a blended time-to-fill number because it shows exactly where your process leaks volume and why.
In practice
- When a sourcing team reports that 80 applications came in but only four reached final rounds, tracking stage-by-stage rates reveals whether the drop happened at screening, at the hiring manager review, or at the offer stage, rather than guessing.
- Hiring managers who ask "why is it taking so long?" often benefit more from a conversion funnel breakdown than a days-elapsed number. A 15% interview-to-offer rate is a different conversation than a 15-day average time in stage.
- TA ops teams building pipeline dashboards in ATS reporting or spreadsheets almost always include conversion rate by stage as one of three or four core views alongside time to fill and source of hire.
Quick read, then how hiring teams use it
This is for recruiters, sourcers, TA leads, and HR partners who need the same vocabulary in debrief calls, vendor reviews, and hiring manager check-ins. Skim the first section for a shared definition. Use the second when you are deciding which stage to investigate and which number to bring to the conversation.
Plain-language summary
- What it means for you: Each step in hiring has a pass rate. Application-to-screen, screen-to-interview, interview-to-offer, and offer-to-accept each have a percentage that tells you whether candidates are progressing normally or dropping at one specific point.
- How you would use it: Pull these numbers from your ATS every quarter, compare them to your own trailing average, and investigate any stage that dropped more than 10 percentage points without an obvious explanation like a hiring freeze.
- How to get started: Open your ATS report for the last 90 days, count candidates who entered each stage and how many moved to the next one, and build a simple four-row table. That is your funnel baseline.
- When it is a good time: Any time a hiring manager says the pipeline feels slow or a recruiter says quality is off. Conversion rate data replaces opinion with a stage-specific number.
When you are running live reqs and tools
- What it means for you: A dip in screen-to-interview rate often surfaces in ATS data a week before a hiring manager raises a concern. Tracking conversion at stage level gives TA ops a leading indicator rather than a lagging complaint.
- When it is a good time: When the same role shows different conversion rates across different sourcers or sourcing channels, that signals a job description problem, a screening criteria problem, or a sourcing targeting issue, rather than a market condition.
- How to use it: Wire your ATS export to a shared dashboard that shows conversion by stage and by source. Flag any stage where conversion drops more than 15 points below the 90-day average. Bring that flag to the weekly debrief with a specific question about that stage rather than a general update.
- How to get started: Use your ATS built-in pipeline report or export stage data to a spreadsheet. Add a column for conversion at each stage (candidates moved forward divided by candidates who entered that stage). Sort by req type to separate roles before drawing conclusions across the funnel.
- What to watch for: Stage skipping, where recruiters move candidates multiple steps at once for speed, which inflates conversion at some stages and hides drops at others. Also watch for bulk-move actions that advance candidates without a disposition code, since those rows corrupt the denominator in your conversion math.
Where we talk about this
On AI with Michal live sessions, hiring funnel conversion rates come up most in the AI in recruiting blocks when we cover how ATS data connects to sourcing decisions and hiring manager reporting. Sourcers also revisit these numbers in the sourcing automation blocks when building dashboards that fire alerts on conversion drops. If you want to see how teams actually read funnel reports and calibrate what the numbers mean together, join at Sourcing Lab and bring your current stage conversion table.
Around the web (opinions and rabbit holes)
Third-party creators move fast. Treat these as starting points, not endorsements, and verify any numbers before using them in executive reporting.
YouTube
- Searching "recruiting funnel conversion rates" on YouTube surfaces practitioner-led walkthroughs from HR consultants, ATS vendors, and TA ops leads who share actual stage-by-stage breakdowns. Filter to videos from the past two years since tool interfaces and benchmarks shift fast.
- Greenhouse, Ashby, and Lever all maintain YouTube channels with platform-specific reporting tutorials that show exactly where conversion rate reports live in the UI, useful if you are evaluating a new ATS.
- Searching "talent acquisition metrics dashboard" alongside your ATS name surfaces vendor-led and community-built walkthroughs that show real funnel reports in context rather than theory.
- r/recruiting discussions on "conversion rates" and "pipeline metrics" show how in-the-chair recruiters interpret stage drops, what they do when offer-accept rates fall, and which ATS reports they actually trust.
- r/humanresources covers the same ground from an HR operations angle, with more discussion of how funnel metrics are presented to leadership and what finance actually asks for.
- r/recruitinghell offers the candidate-side view of why offer-accept rates drop, which is sometimes more useful than the TA-side analysis when you are trying to diagnose a late-funnel conversion problem.
Quora
- What is a good conversion rate at each stage of the hiring funnel? returns practitioner estimates and caveats from recruiters across industries (quality varies, so read critically and cross-check against your own ATS data before citing anything in a leadership deck).
Hiring funnel stages and typical conversion ranges
| Stage | Typical conversion range | Common cause of drop |
|---|---|---|
| Application to phone screen | 10-30% | Job description mismatch or wrong sourcing channel |
| Phone screen to first interview | 30-50% | Misaligned hiring manager expectations or scorecard |
| First interview to final round | 40-60% | Competency gaps or under-prepared interview panels |
| Final interview to offer | 30-50% | Compensation miss or slow process losing candidates |
| Offer to accept | 80-90% | Competing offers, candidate experience, or timing |
Related on this site
- Glossary: Talent acquisition metrics, Time to fill, Scorecard, Adverse impact, Proprietary talent pool, Talent data aggregators, Applicant tracking software
- Blog: AI sourcing tools for recruiters
- Live cohort: Sourcing Lab
- Membership: Become a member