Funnel drop-off analysis
Examining each hiring pipeline stage to find where and why candidate volume exits before the next step, so TA teams can target the specific constraint rather than overhauling the whole process.
Michal Juhas · Last reviewed May 8, 2026
What is funnel drop-off analysis?
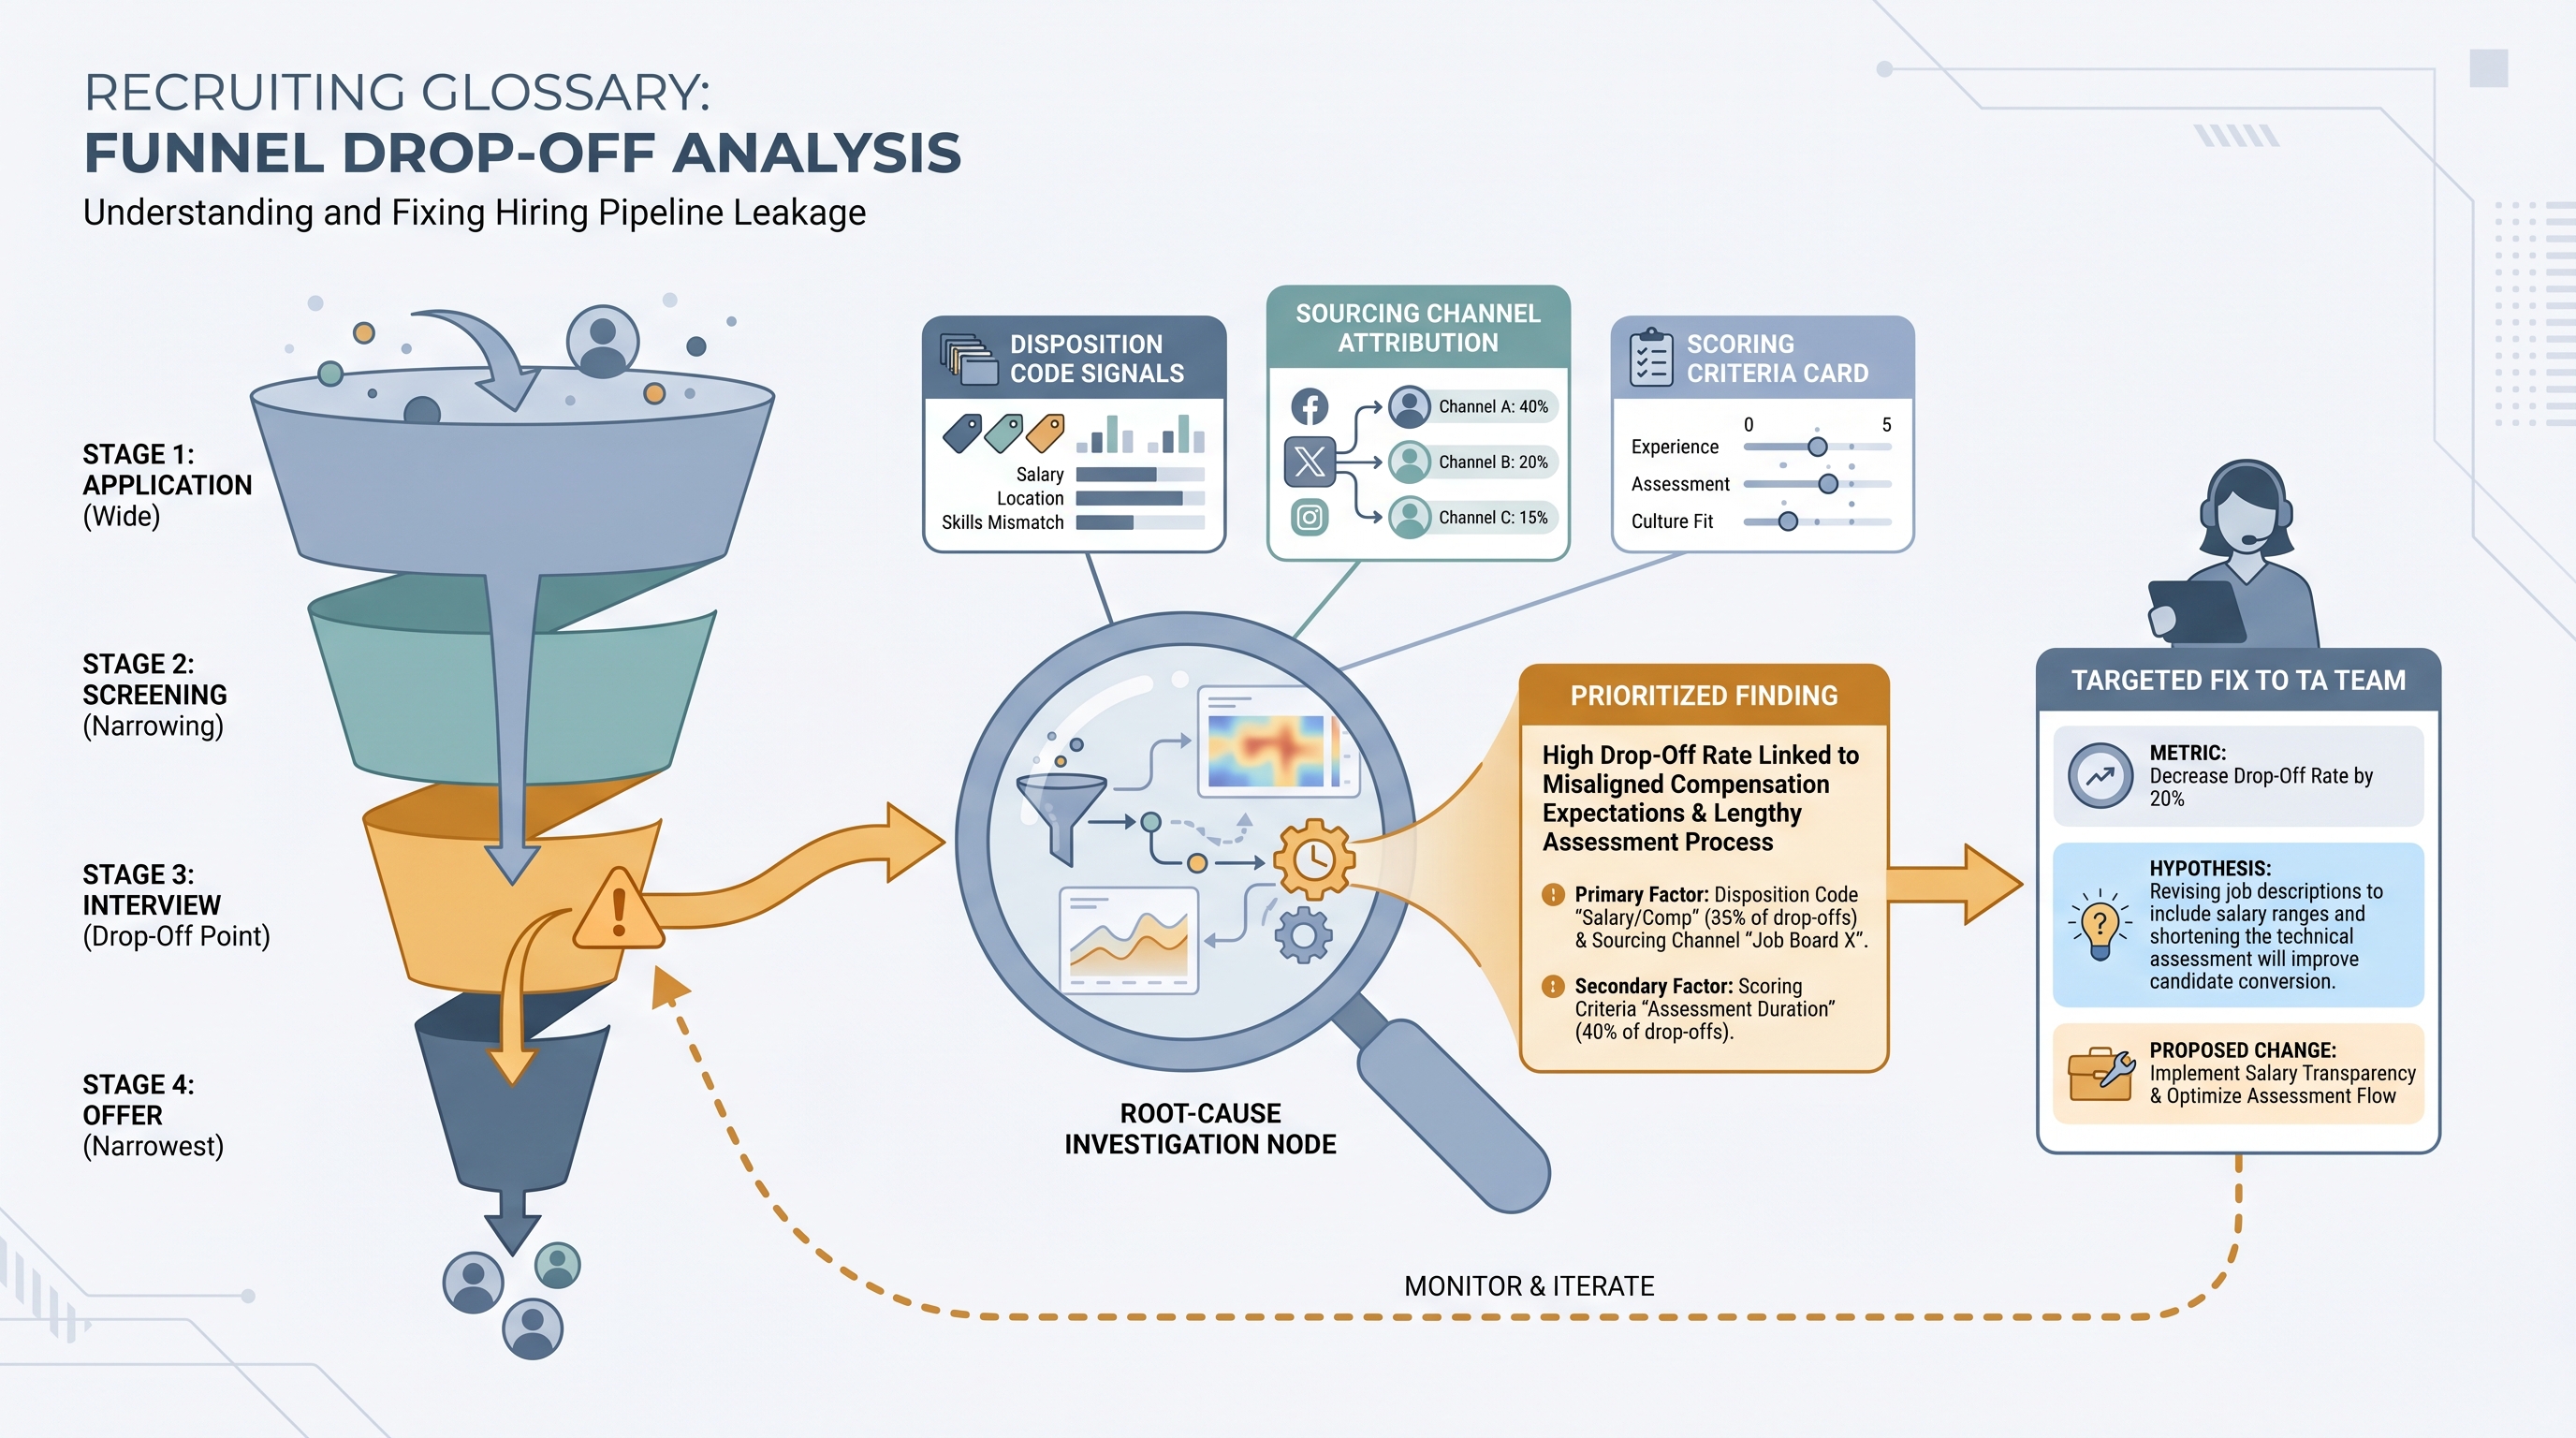
Funnel drop-off analysis is the practice of measuring where candidates exit the hiring pipeline at each stage transition, then diagnosing why. Every hiring process has a shape: many candidates enter at the top and far fewer reach an accepted offer. Measuring each step individually tells you more than a blended time-to-fill number because it shows exactly where your process leaks volume. The analysis step goes beyond reporting the percentage: you review rejection codes, sourcing channel data, interviewer feedback, and requisition characteristics to find what is actually causing the exit. A drop at screening is a different problem than a drop at offer, and fixing the wrong one wastes sourcing budget without moving the real bottleneck.
In practice
- A TA ops lead who notices one req has a 12% application-to-screen rate while similar reqs run at 35% will pull disposition codes and usually finds one repeat reason: the job title attracted a different seniority band than the actual work requires.
- Hiring managers who ask for a pipeline update often get more value from a weekly stage conversion table than a count of new applications, because the drop-off pattern answers their real question faster.
- Teams building automated alerts in their ATS or a dashboard tool will set a threshold at around 15 percentage points below the 90-day average for screen conversion, which fires a notification to the recruiter before the hiring manager raises a concern.
Quick read, then how hiring teams use it
This is for recruiters, sourcers, TA leads, and HR partners who need the same vocabulary in debrief calls, vendor reviews, and hiring manager updates. Skim the first section for a shared definition. Use the second when you are deciding which stage to investigate and which number to bring to the conversation.
Plain-language summary
- What it means for you: Funnel drop-off analysis finds the specific step where candidates stop moving forward, then tries to explain why. It turns "the pipeline is slow" into "47% of candidates are declining after the first interview, and most cited compensation."
- How you would use it: Pull stage conversion numbers from your ATS for the last 90 days, compare each stage to your own historical average, and investigate only the stage that dropped most rather than overhauling the entire funnel at once.
- How to get started: Build a simple four-row table: candidates in and candidates out for each stage. Calculate the percentage. Flag any number more than 10 points below your previous quarter average. That is the stage to investigate first.
- When it is a good time: When a hiring manager says the pipeline feels slow, when offer-accept rates drop two quarters in a row, or when a sourcing channel starts sending higher volume but worse conversion at screening.
When you are running live reqs and tools
- What it means for you: A conversion dip at one stage fires differently depending on whether it appears across all reqs or only one job family, one sourcing channel, or one hiring manager's reqs. That segmentation is how you get from a number to a root cause.
- When it is a good time: When a req has been open more than 30 days and the pipeline is thinning, funnel analysis by stage identifies whether you need to source more at the top or fix a criterion that is filtering out candidates who would have progressed.
- How to use it: Combine your ATS stage export with sourcing channel attribution and disposition codes. Compare drop-off rates by channel, by req type, and by hiring manager. Bring one metric, one hypothesis, and one proposed change to the debrief, not a full report.
- How to get started: Export the last 90 days of stage data from your ATS. Add a column for conversion percentage at each stage. Filter by req type to avoid comparing a high-volume support role to an executive search. Sort by the stage with the biggest quarter-over-quarter drop.
- What to watch for: Stage skipping, where recruiters advance candidates multiple steps to save clicks, which compresses conversion rates for middle stages and makes a real drop invisible. Also watch for disposition codes that are too generic, such as "not a fit," which produce a number but no diagnostic value.
Where we talk about this
On AI with Michal live sessions, funnel drop-off analysis comes up in AI in recruiting blocks when teams use ATS data to drive sourcing decisions rather than relying on intuition. The sourcing automation blocks also cover alert-based monitoring that fires when a stage conversion drops below a rolling threshold. If you want to see how teams read these numbers together and decide which stage to fix first, join at Sourcing Lab and bring your own stage conversion table from the last 90 days.
Around the web (opinions and rabbit holes)
Third-party creators move fast. Treat these as starting points, not endorsements, and verify any benchmark before using it in executive reporting.
YouTube
- Searching "recruiting funnel analysis" or "hiring pipeline drop-off" on YouTube surfaces practitioner walkthroughs from TA ops leads and ATS vendors showing where the numbers live in their reporting tools. Filter to videos from the last two years since product interfaces change.
- Greenhouse and Ashby both maintain YouTube channels with platform-specific pipeline analytics tutorials that show real conversion report layouts and how to export stage data.
- Searching "talent acquisition funnel analysis" alongside your ATS name returns community walkthroughs of how recruiters read and act on stage conversion data.
- r/recruiting discussions on "pipeline conversion" or "why are candidates dropping out" show how in-the-chair recruiters interpret stage dips and what questions they bring to debrief calls.
- r/humanresources covers funnel analysis from an HR operations angle, including how these numbers get summarized for quarterly people reviews and leadership presentations.
- r/recruitinghell provides the candidate perspective on why offers get declined or processes stall, useful context when the data shows a late-funnel drop that disposition codes do not fully explain.
Quora
- Searching "how to analyze hiring funnel drop-off" returns practitioner estimates and caveats from recruiters across industries. Quality varies, so read critically and verify against your own ATS data before citing anything in a leadership deck.
Funnel drop-off: typical stages and root cause patterns
| Stage | Common drop-off cause | First thing to check |
|---|---|---|
| Application to screen | Job description mismatch, wrong sourcing channel | Disposition codes and channel attribution |
| Screen to interview | Scorecard misalignment, criteria drift | Rejection reasons from recruiter notes |
| Interview to final round | Competency bar unclear, slow scheduling | Interviewer feedback patterns, calendar data |
| Final round to offer | Compensation positioning, competing offer | Offer decline survey or exit conversation |
| Offer to accept | Competing offer, candidate experience issues | Offer acceptance timeline and candidate feedback |
Related on this site
- Glossary: Hiring funnel conversion rates, Talent acquisition metrics, Time to fill, Scorecard, Adverse impact, Sourcing funnel metrics, Applicant tracking software, Requisition funnel reporting
- Blog: AI sourcing tools for recruiters
- Live cohort: Sourcing Lab
- Membership: Become a member