Compensation benchmarking
The process of comparing your organisation's salary and total compensation packages against external market data to determine whether pay is competitive enough to attract and retain the talent you need.
Michal Juhas · Last reviewed May 23, 2026
What is compensation benchmarking?
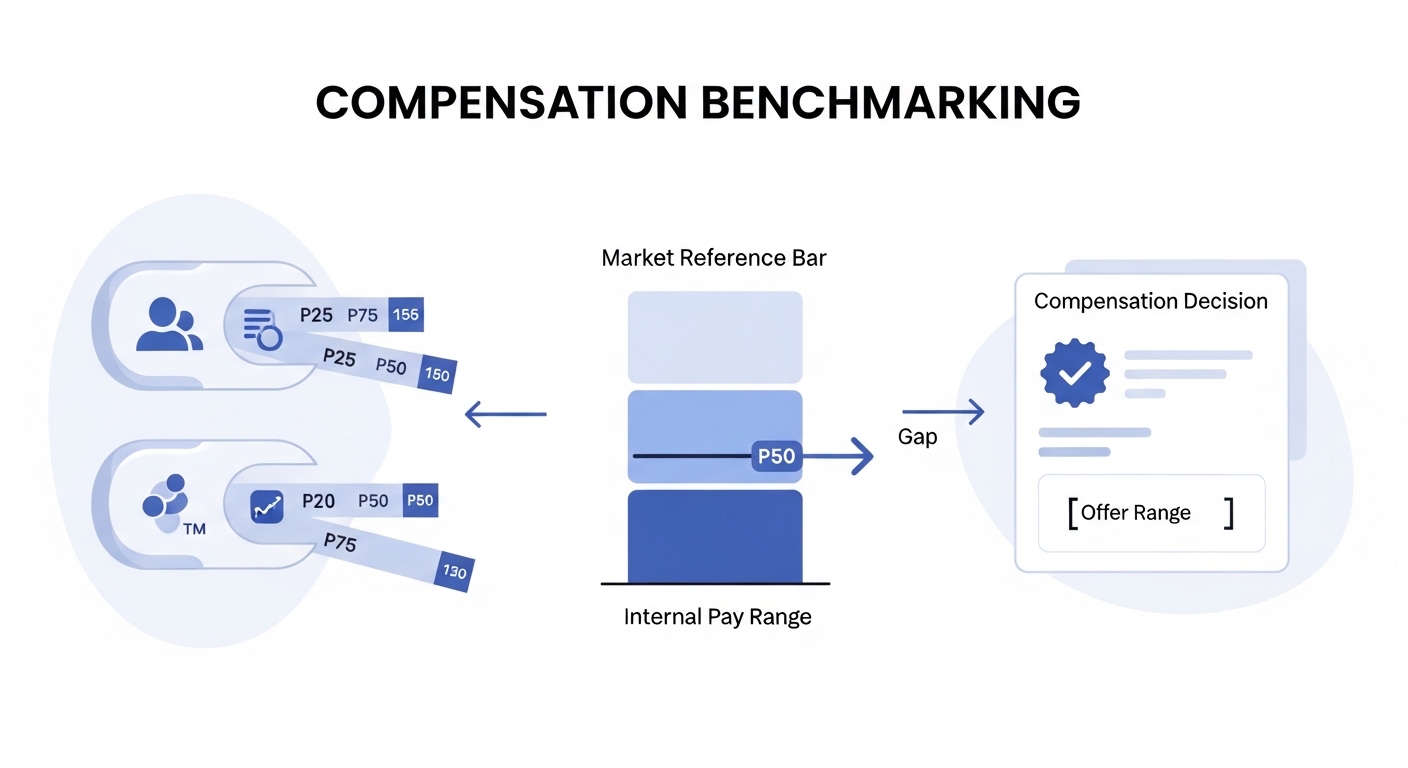
Compensation benchmarking is the structured comparison of your pay ranges against external market data. It tells you where your salary bands sit relative to what comparable employers pay for equivalent roles at equivalent levels in equivalent locations. TA teams use benchmarks to design offer ranges, prepare for offer conversations with hiring managers, and diagnose why candidates decline at the finish line. Without it, you are guessing whether your offer is competitive or just hoping the candidate will not compare notes.
In practice
- A TA lead at a Series B startup benchmarks a senior data engineer role against Levels.fyi and Radford data and discovers their midpoint is 22 percent below P50 for their city. They bring the data to the CEO and get the band revised before posting. Time-to-fill drops by 18 days on the next hire.
- A recruiter uses LinkedIn Salary Insights during an intake call with a hiring manager to show in real time that the approved budget for a role is below the market P25. The manager adjusts the range before sourcing begins.
- A comp analyst says the benchmark is "stale" when market data from the previous year's survey cycle no longer matches what candidates are asking for in first-round conversations.
Quick read, then how hiring teams use it
This is for recruiters, sourcers, TA, and HR partners who need the same vocabulary in debriefs, vendor calls, and policy reviews. Skim the first section when you need a fast shared picture. Use the second when you are deciding how it fits into your offer process.
Plain-language summary
- What it means for you: Knowing whether your offer is in the competitive zone before you make it, so you do not lose candidates at the last step because a competitor is paying more.
- How you would use it: Pull market data for the role and location, find the P50 and P75 figures, compare to your current band, and flag gaps to your hiring manager at intake time rather than offer time.
- How to get started: Pick the three roles you hire most often. Look up each on two salary data sources. Write down whether your midpoint is above or below the market P50. Bring the gap data to your next hiring manager conversation.
- When it is a good time: Any time you are seeing offer declines, long time-to-fill, or candidates pushing back on compensation during final-round conversations.
When you are running live reqs and tools
- What it means for you: Compensation benchmarks are an input to offer strategy, headcount planning, and job description copywriting. When your bands are below market, every sourcing and screening investment is at risk at the offer stage.
- When it is a good time: During annual compensation review cycles, at the intake stage for new reqs in competitive talent segments, and whenever your offer decline rate for a role family rises above 20 percent.
- How to use it: Build a simple benchmarking sheet for your top 10 roles: external P25, P50, P75 from two sources, your current band minimum and midpoint, and the gap percentage. Share it with hiring managers at intake, not at offer. Refresh quarterly for high-decline roles.
- How to get started: Sign up for free tiers of Glassdoor Employer, LinkedIn Salary Insights, or Levels.fyi (tech roles). Pull three data points for your most recently declined offer role. See whether your midpoint is above or below the market median before your next intake call.
- What to watch for: Survey data that lags the market by 12 to 18 months (common in annual survey cycles), self-reported platforms that skew toward actively job-seeking candidates (usually higher than your target employee), and geographic aggregations that blend high-cost and low-cost locations.
Where we talk about this
On AI with Michal live sessions, compensation benchmarking comes up in the context of closing strategy and offer design: specifically how to equip recruiters with data that works in a room with a skeptical hiring manager. See AI Recruiting Accelerator.
Around the web (opinions and rabbit holes)
Third-party creators move fast. Treat these as starting points, not endorsements, and verify any benchmark figure against your own sources before using it in an offer conversation.
YouTube
- Search "compensation benchmarking tutorial" on YouTube for walkthroughs of how to read Radford and Mercer survey outputs and map them to internal bands.
- Search "how to use Levels.fyi for compensation" for tech-specific benchmarking videos, including how to filter by company size and location.
- r/humanresources has threads on which survey providers are worth the cost for different company sizes and industries.
- r/cscareerquestions is a candid source for real software engineering compensation data, with discussions of what candidates actually see in competing offers.
Quora
- How do companies benchmark salaries? collects practitioner explanations of the survey and aggregator approaches used in real HR departments.
Related on this site
- Glossary: offer decline analysis in hiring, talent acquisition metrics, time to fill
- Glossary: quality of hire, hiring funnel conversion rates
- Live cohort: AI Sourcing Lab
- Membership: Become a member