Pipeline coverage reporting
The practice of tracking whether each open requisition has enough active candidates at every funnel stage to reliably produce a hire by the target date, based on historical stage-by-stage conversion rates.
Michal Juhas · Last reviewed May 8, 2026
What is pipeline coverage reporting?
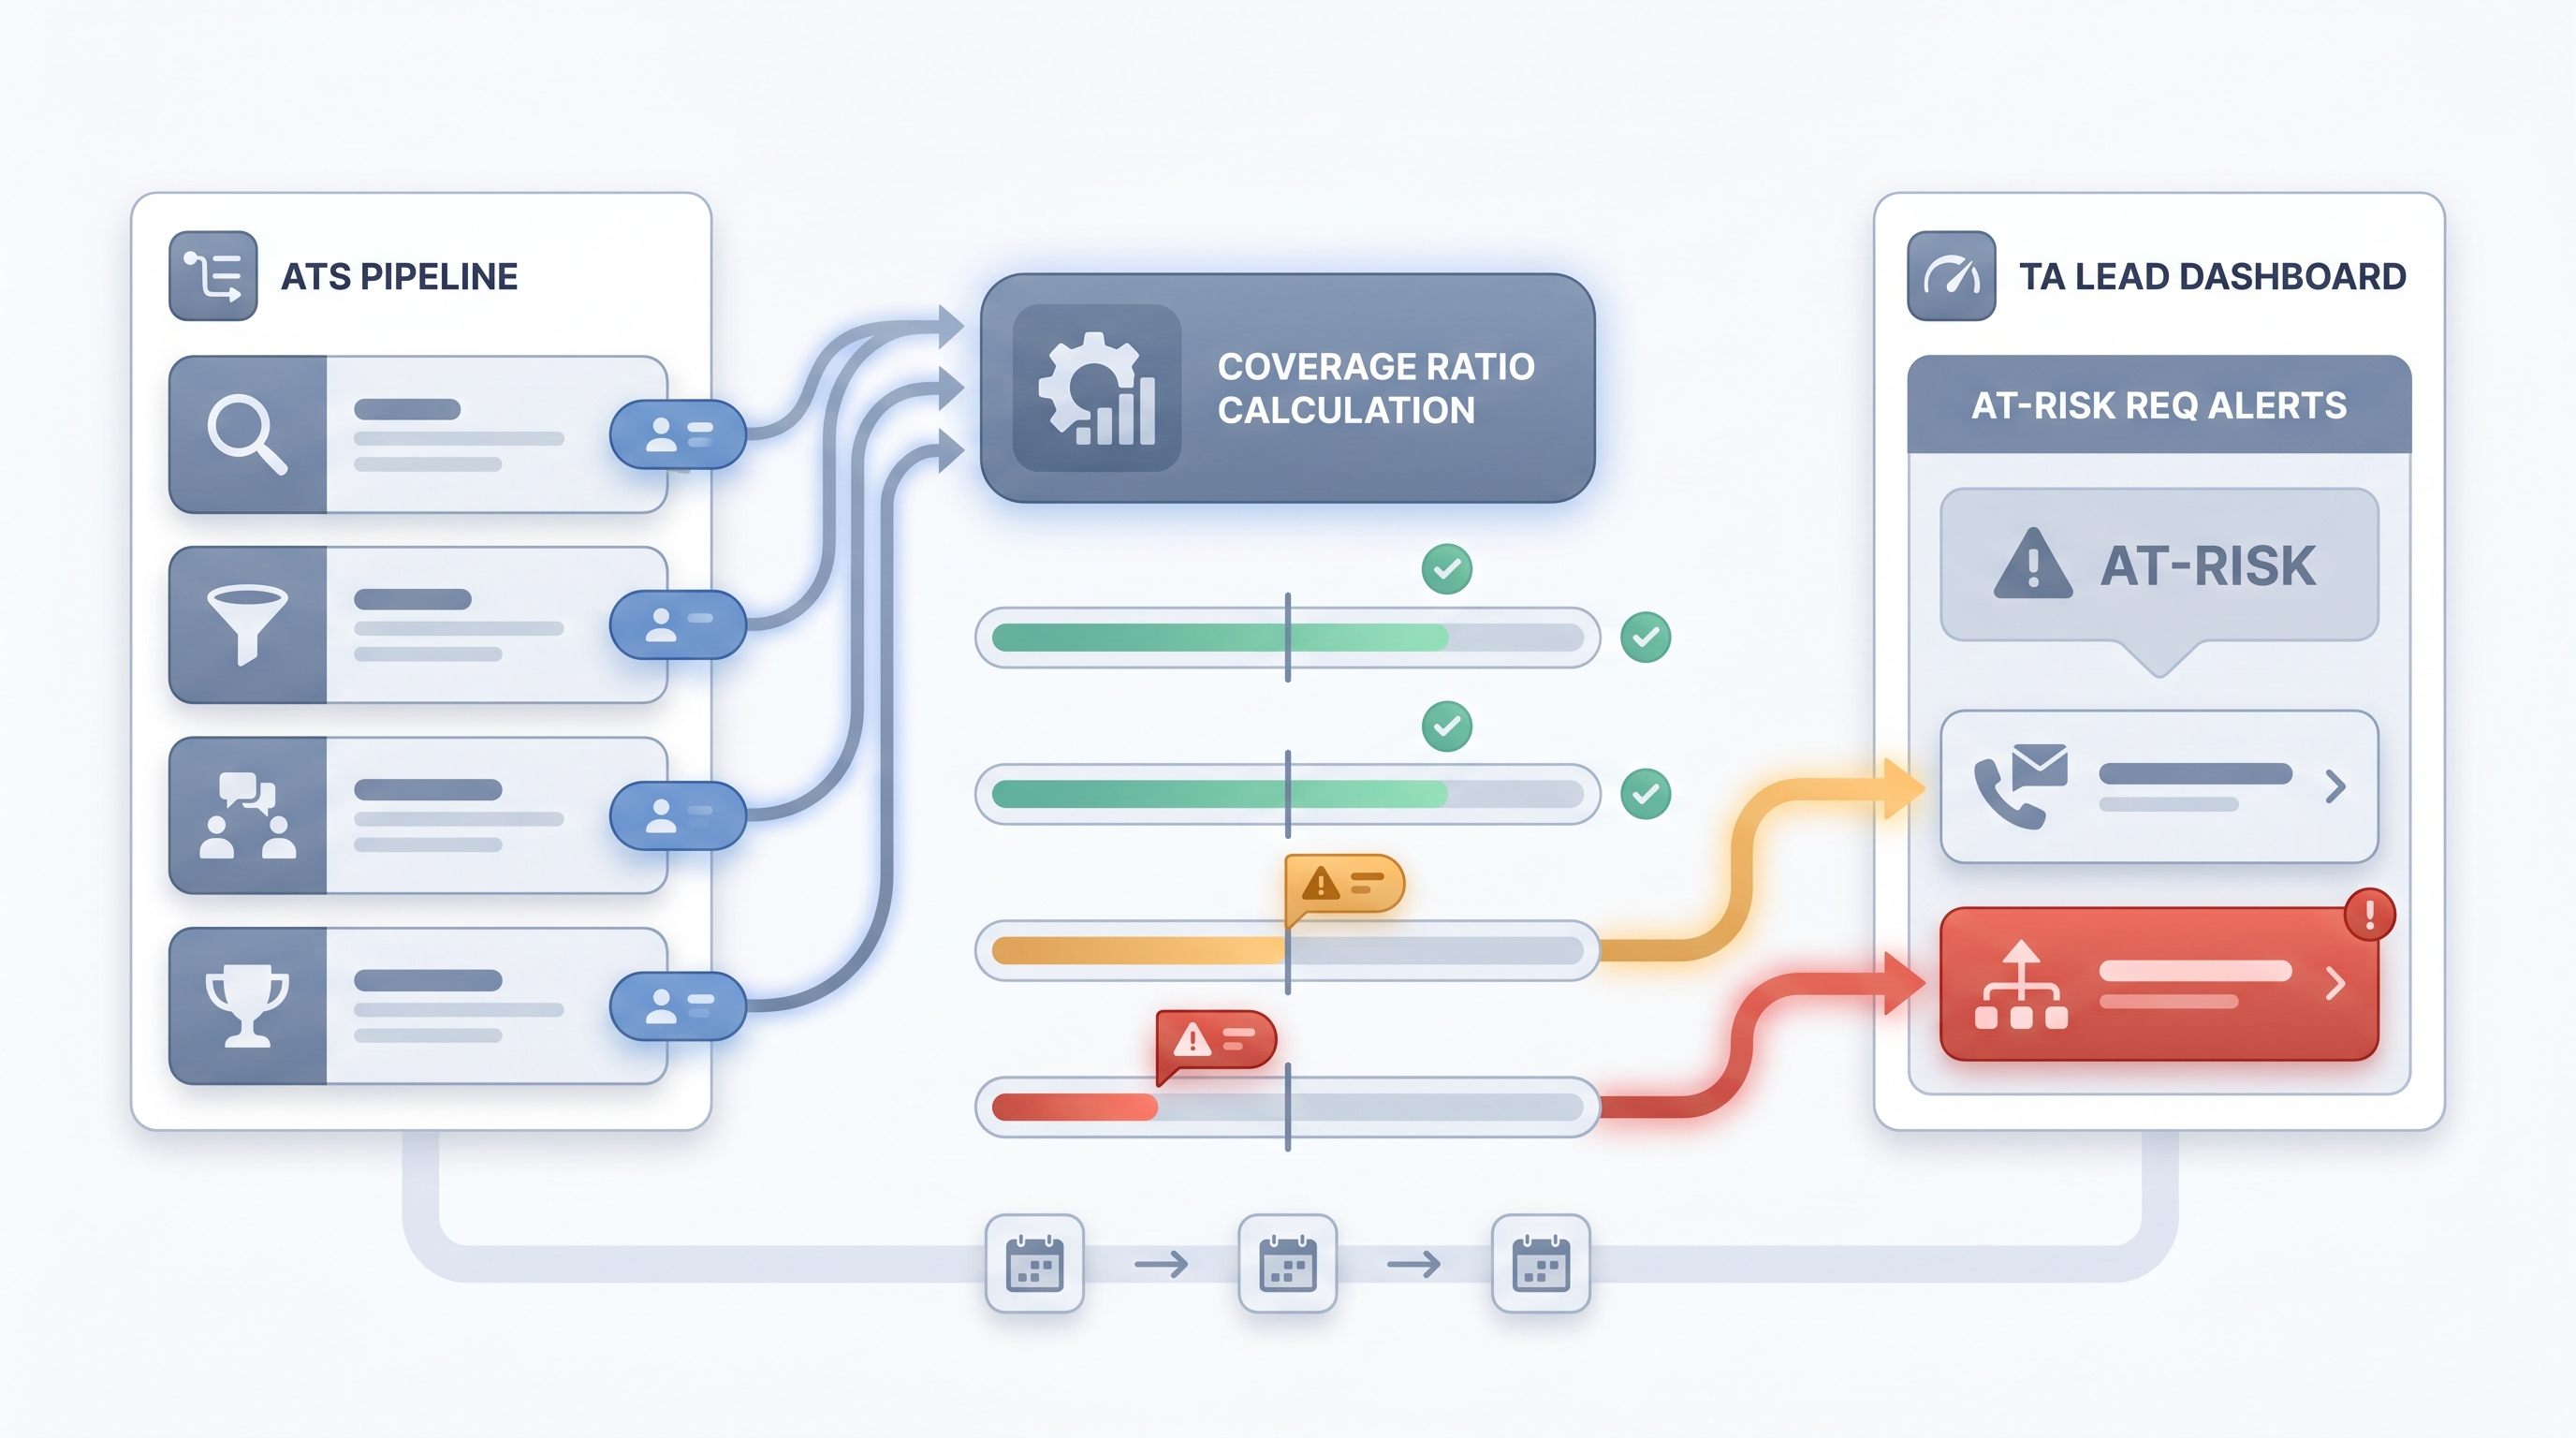
Pipeline coverage reporting is the practice of tracking whether each open requisition has enough active candidates at every funnel stage to reliably produce a hire by the target date. It is a forward-looking TA operations discipline. Instead of waiting for time-to-fill to signal a problem after a req slips, coverage reporting gives TA leads and hiring managers a weekly amber or red signal while there is still time to act.
Coverage is expressed as a ratio of active candidates in a stage to the number needed, based on historical conversion rates for that role type. A senior engineering req with a historical 4:1 screened-to-offer conversion needs four actively progressing screened candidates to expect one accepted offer.
In practice
- A TA ops lead running a Monday standup might say "legal has 1.8x coverage at final round, which is below our 3x threshold" as shorthand for "we are behind on that req and need to act this week."
- A hiring manager briefing might use the phrase "light pipeline" to mean the same thing without the ratio language, while TA is calculating exact coverage behind the scenes using ATS stage counts.
- Automated weekly digests pulled from ATS stage exports, annotated with coverage ratios and last-activity dates, replace the Friday afternoon spreadsheet most TA ops teams still maintain manually.
Quick read, then how hiring teams use it
This is for recruiters, sourcers, TA, and HR partners who need the same vocabulary in standups, vendor calls, and pipeline reviews. Skim the first section when you need a fast shared picture. Use the second when you are deciding how coverage shows up in ATS reporting, sourcing prioritization, or hiring manager communication.
Plain-language summary
- What it means for you: Coverage reporting tells you whether the funnel for each open role has enough candidates at each step to expect a hire on time, not just whether sourcing looks busy.
- How you would use it: Pull stage counts from your ATS each week, compare them to the conversion multiplier for that role type, and flag any req where the ratio falls below your threshold (often 3:1 at the screen stage).
- How to get started: Start with your two most critical open reqs. Export stage counts, calculate a simple ratio, and share it with the hiring manager in plain language. Refine the threshold over the next three hires.
- When it is a good time: Any time you have more than five open reqs and need a data-driven way to prioritize sourcing effort or escalate to a hiring manager.
When you are running live reqs and tools
- What it means for you: Coverage reporting replaces gut-feel standup updates with a structured view across all live reqs. When integrated with your ATS API and an automation layer, alerts fire before a req slips rather than after.
- When it is a good time: Weekly at minimum. Daily for reqs with hard deadlines or below-threshold coverage. Pair with time-in-stage reporting so you know both whether coverage is low and where candidates are stalling.
- How to use it: Pull stage counts, apply your conversion multipliers, and route amber and red reqs to a Slack alert or TA ops digest. Use structured output from an LLM to parse messy ATS exports into coverage tables if your ATS does not expose clean API data.
- How to get started: Build the simplest version first: one spreadsheet column with stage counts, one column with the coverage ratio, and a conditional format for anything below threshold. Add automation once the threshold logic is validated and trusted by hiring managers.
- What to watch for: Stale candidates (no activity in 14-plus days) inflating ratios; single-channel sourcing creating fragile coverage; hiring manager lag where candidates pile up at HM review without decisions. These are coverage quality issues the ratio alone does not catch.
Where we talk about this
On AI with Michal live sessions, pipeline coverage comes up in both the AI in recruiting and sourcing automation tracks, because coverage problems are usually either a sourcing-volume issue (the top of funnel needs more contacts) or a process issue (candidates stall at hiring manager review). If you want to see a live coverage dashboard built from real ATS exports and hear which thresholds teams actually act on, start at Sourcing Lab and bring the stage counts for your most challenging open reqs.
Around the web (opinions and rabbit holes)
Third-party creators move fast. Treat these as starting points, not endorsements, and double-check anything before you wire candidate data.
YouTube
- Building a Recruiting Dashboard with Google Sheets (SheCanCode) walks a pipeline visibility build that TA ops teams adapt for coverage tracking.
- How to Create a Recruitment Dashboard in Excel shows stage-count and conversion-rate tables that map directly to coverage ratio logic.
- Talent Acquisition Metrics and Analytics covers the TA metrics landscape including pipeline health concepts for TA leaders building executive reporting.
- How do you track pipeline health across all your reqs? in r/recruiting has frank answers from in-house TA teams on how they actually monitor coverage.
- Best way to report pipeline status to HMs? in r/recruiting covers the communication challenge of turning ratio data into hiring manager action.
Quora
- How do talent acquisition teams measure pipeline health? collects practitioner answers on metrics, tools, and reporting cadences (quality varies; read critically).
Pipeline coverage vs sourcing funnel metrics
| Pipeline coverage reporting | Sourcing funnel metrics | |
|---|---|---|
| Unit of analysis | Per req | Per sourcing motion |
| Key question | Enough to hire on time? | Is outreach landing? |
| Who acts on it | TA lead, hiring manager | Sourcer, TA ops |
| Direction | Forward-looking (req risk) | Forward-looking (input quality) |
| Primary data source | ATS stage counts | Outreach tool, ATS source field |
Related on this site
- Glossary: Sourcing funnel metrics, Time-to-fill, Time in stage reporting, Hiring funnel conversion rates, Weekly hiring funnel report, Talent acquisition metrics
- Tools: AI sourcing tools
- Live cohort: Sourcing Lab
- Course: Starting with AI: the foundations in recruiting
- Membership: Become a member