Stage conversion in the hiring funnel
The percentage of candidates who advance from one hiring pipeline stage to the next, used to measure process health, identify bottlenecks, and guide decisions about sourcing volume, criteria calibration, and interview design.
Michal Juhas · Last reviewed May 8, 2026
What is stage conversion in the hiring funnel?
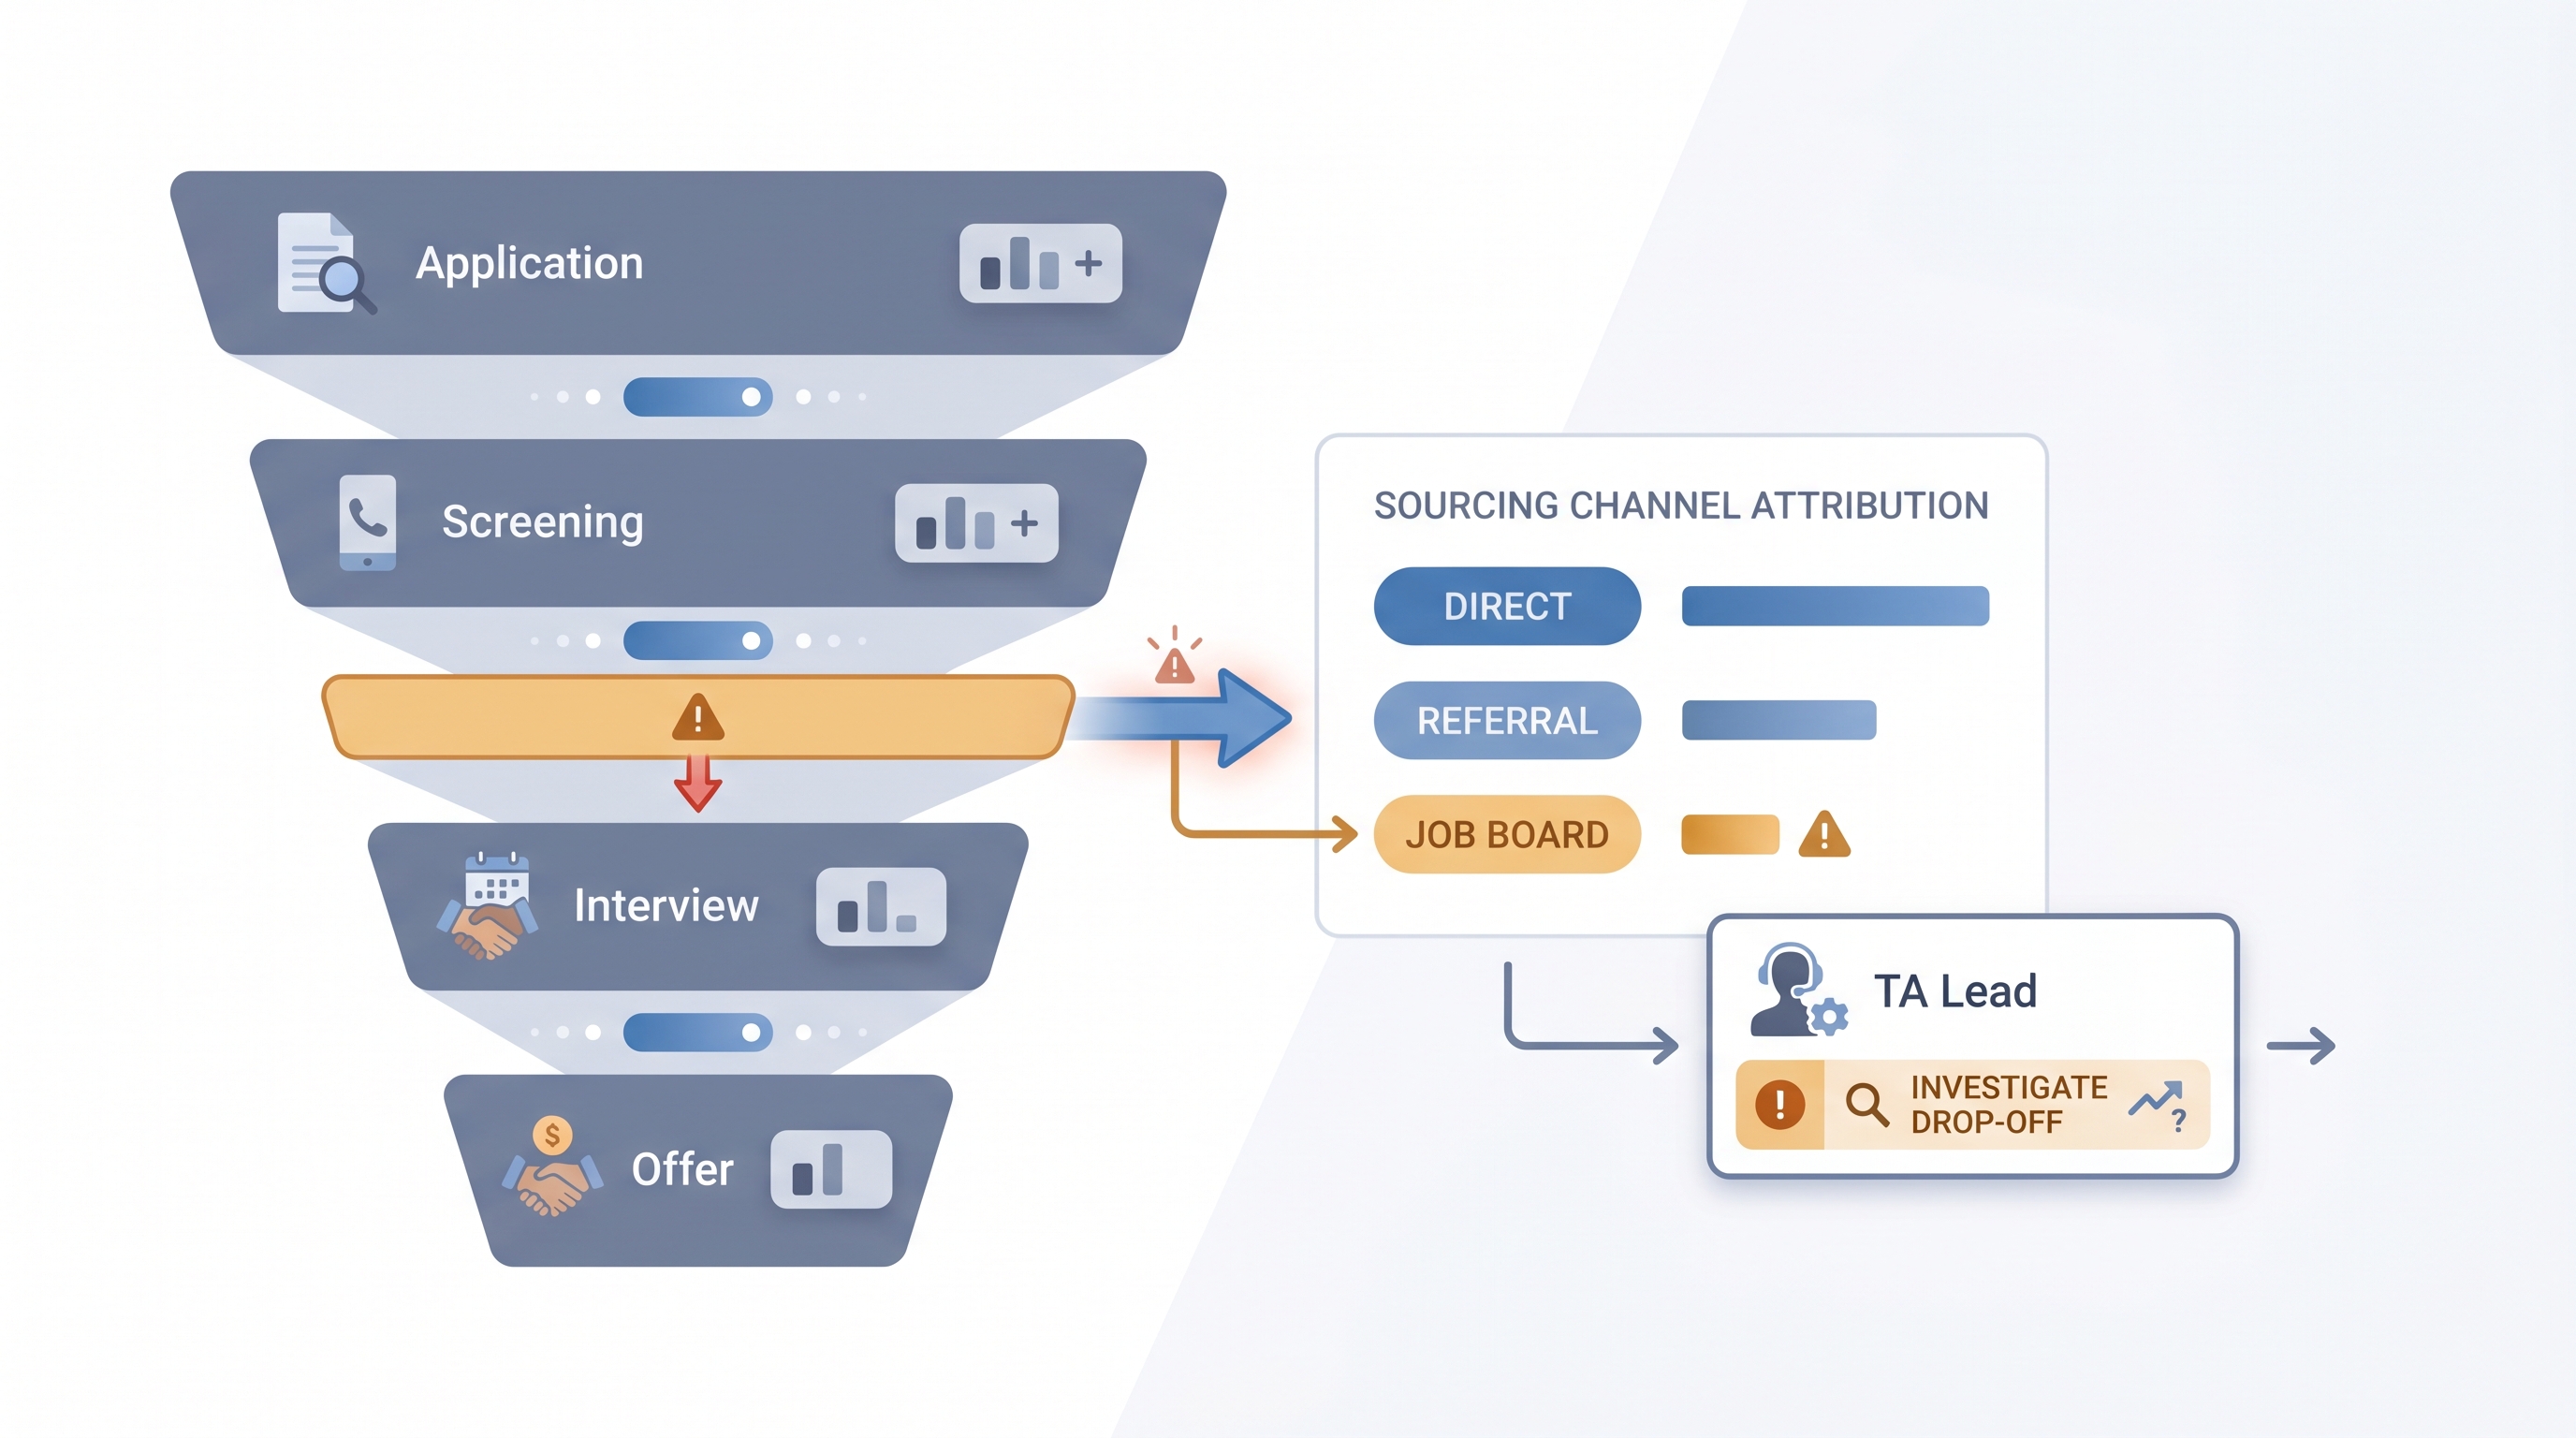
Stage conversion is the percentage of candidates who advance from one pipeline step to the next in a defined hiring process. When 80 candidates reach a phone screen and 28 move to a first interview, the screen-to-interview stage conversion is 35%. Most teams track this number per stage because a single blended pipeline rate hides where the real constraint lives. A funnel that converts 12% application-to-hire overall can have that drop distributed across every stage or concentrated entirely at one step, and those two situations require completely different fixes.
The metric is straightforward to calculate once stage names and disposition codes are consistent in your ATS. The harder part is making the data usable: standardizing stage names, logging sourcing channel per candidate, and using specific enough disposition codes that a drop triggers a hypothesis rather than just a number.
In practice
- A TA ops lead tracking six active reqs notices one software engineering role has a 14% screen-to-interview rate while three similar reqs are running at 42%. Pulling disposition codes reveals 70% of screens are being declined for a scope mismatch that appeared after the hiring manager updated the intake form mid-search.
- A recruiter presenting a weekly pipeline update replaces headcount per stage with stage conversion percentages, which shifts the conversation from "where are we in the funnel" to "why did offer acceptance drop this quarter."
- In a AI Sourcing Lab session, participants build an alert that fires a Slack message to the req owner when a stage conversion dips more than 15 percentage points below the 90-day rolling average, catching stalls before a hiring manager notices the empty calendar.
Quick read, then how hiring teams use it
This is for recruiters, TA leads, and HR partners who need a shared vocabulary in pipeline reviews, sourcing decisions, and hiring manager conversations. Skim the first section for a fast shared picture. Use the second when you are deciding which stage to investigate or how to present the data.
Plain-language summary
- What it means for you: Stage conversion tells you what percentage of candidates made it from one step to the next. If most candidates drop at one specific point, that is where the process needs attention, not everywhere.
- How you would use it: Pull the last 90 days of stage data from your ATS, calculate the percentage advancing at each step, and compare each number to your own historical average. Flag the stage furthest below its baseline.
- How to get started: Make sure your ATS uses consistent stage names across all active reqs and that every candidate exit has a disposition code. Without those two things, the percentages will not be comparable across roles.
- When it is a good time: When a hiring manager says the pipeline is slow, when an offer-accept rate drops two months in a row, or when sourcing volume is up but hire rate is flat.
When you are running live reqs and tools
- What it means for you: Stage conversion broken out by sourcing channel, hiring manager, or job family turns a single percentage into an attribution signal. A 40-point spread between two sourcing channels at the same stage tells you the channel is the variable, not the criteria.
- When it is a good time: After 30 or more days of data for a given req type and stage, so single-event noise does not trigger a false alarm that wastes sourcing effort.
- How to use it: Export stage data weekly from the ATS, segment by req type and channel, and compare to the previous period. Bring one conversion delta, one hypothesis, and one proposed change to the weekly pipeline review rather than a full funnel report.
- How to get started: Set up a disposition code menu with at least five specific reasons for candidate exits at each stage. Generic codes like "not a fit" produce counts but not signal. Then build a simple pivot against those codes to find the dominant exit reason at the stage that is dropping.
- What to watch for: Stage skipping in the ATS inflates some conversion rates by collapsing two steps into one click. Also watch for correlation bias in AI-assisted analysis: a pattern showing one hiring manager's reqs underperforming may reflect sourcing channel differences, not hiring manager quality, until you control for channel.
Where we talk about this
On AI with Michal live sessions, stage conversion comes up in AI in recruiting blocks when teams use ATS pipeline data to decide whether to add sourcing volume or fix a middle-funnel problem. The sourcing automation track shows how to set up automated stage conversion alerts that fire when a threshold is crossed. If you want to see how teams read these numbers, calibrate thresholds, and bring the right metric to a hiring manager conversation, join at Sourcing Lab and bring a recent stage export from your own ATS.
Around the web (opinions and rabbit holes)
Third-party creators move fast. Treat these as starting points, not endorsements, and verify any benchmark before using it in executive reporting.
YouTube
- Searching "recruiting funnel conversion rate" or "ATS pipeline analytics" returns vendor walkthroughs from Greenhouse, Ashby, and Lever showing where stage conversion lives in their reporting dashboards. Filter to the last two years since interfaces change.
- TA ops practitioners post process-improvement walkthroughs that show how to export, clean, and pivot stage data without custom tooling, useful before building automated alerts.
- Searching "talent acquisition metrics dashboard" returns sessions from TA conference recordings where teams present how they structure pipeline reporting for quarterly people reviews.
- r/recruiting discussions on "pipeline metrics" and "conversion rates" include real estimates from practitioners across industries, with useful caveats about why external benchmarks rarely transfer to a specific team's process.
- r/humanresources covers stage reporting from the HR operations angle, including how these numbers surface in quarterly business reviews and HRBP conversations about hiring velocity.
- r/recruitinghell gives the candidate view of pipeline stalls and offer declines, useful context when the data shows a late-funnel drop that disposition codes do not fully explain.
Quora
- Searching "what is a good screen to interview conversion rate" returns practitioner estimates across industries. Read critically and anchor on your own historical data before using any figure from an external source in a report.
Stage conversion vs related metrics
| Metric | What it measures | When to use it |
|---|---|---|
| Stage conversion | Candidates advancing per step | Weekly pipeline health check |
| Funnel drop-off analysis | Root cause of a conversion dip | When a conversion falls below baseline |
| Time to fill | Days from req open to accepted offer | Executive hiring velocity report |
| Sourcing funnel metrics | Contacted to submitted per channel | Evaluating outbound sourcing campaigns |
Related on this site
- Glossary: Hiring funnel conversion rates, Funnel drop-off analysis, Sourcing funnel metrics, Talent acquisition metrics, Time to fill, Scorecard, Applicant tracking software, Requisition funnel reporting, Weekly hiring funnel report
- Blog: AI sourcing tools for recruiters
- Live cohort: Sourcing Lab
- Membership: Become a member