HR analytics in recruitment
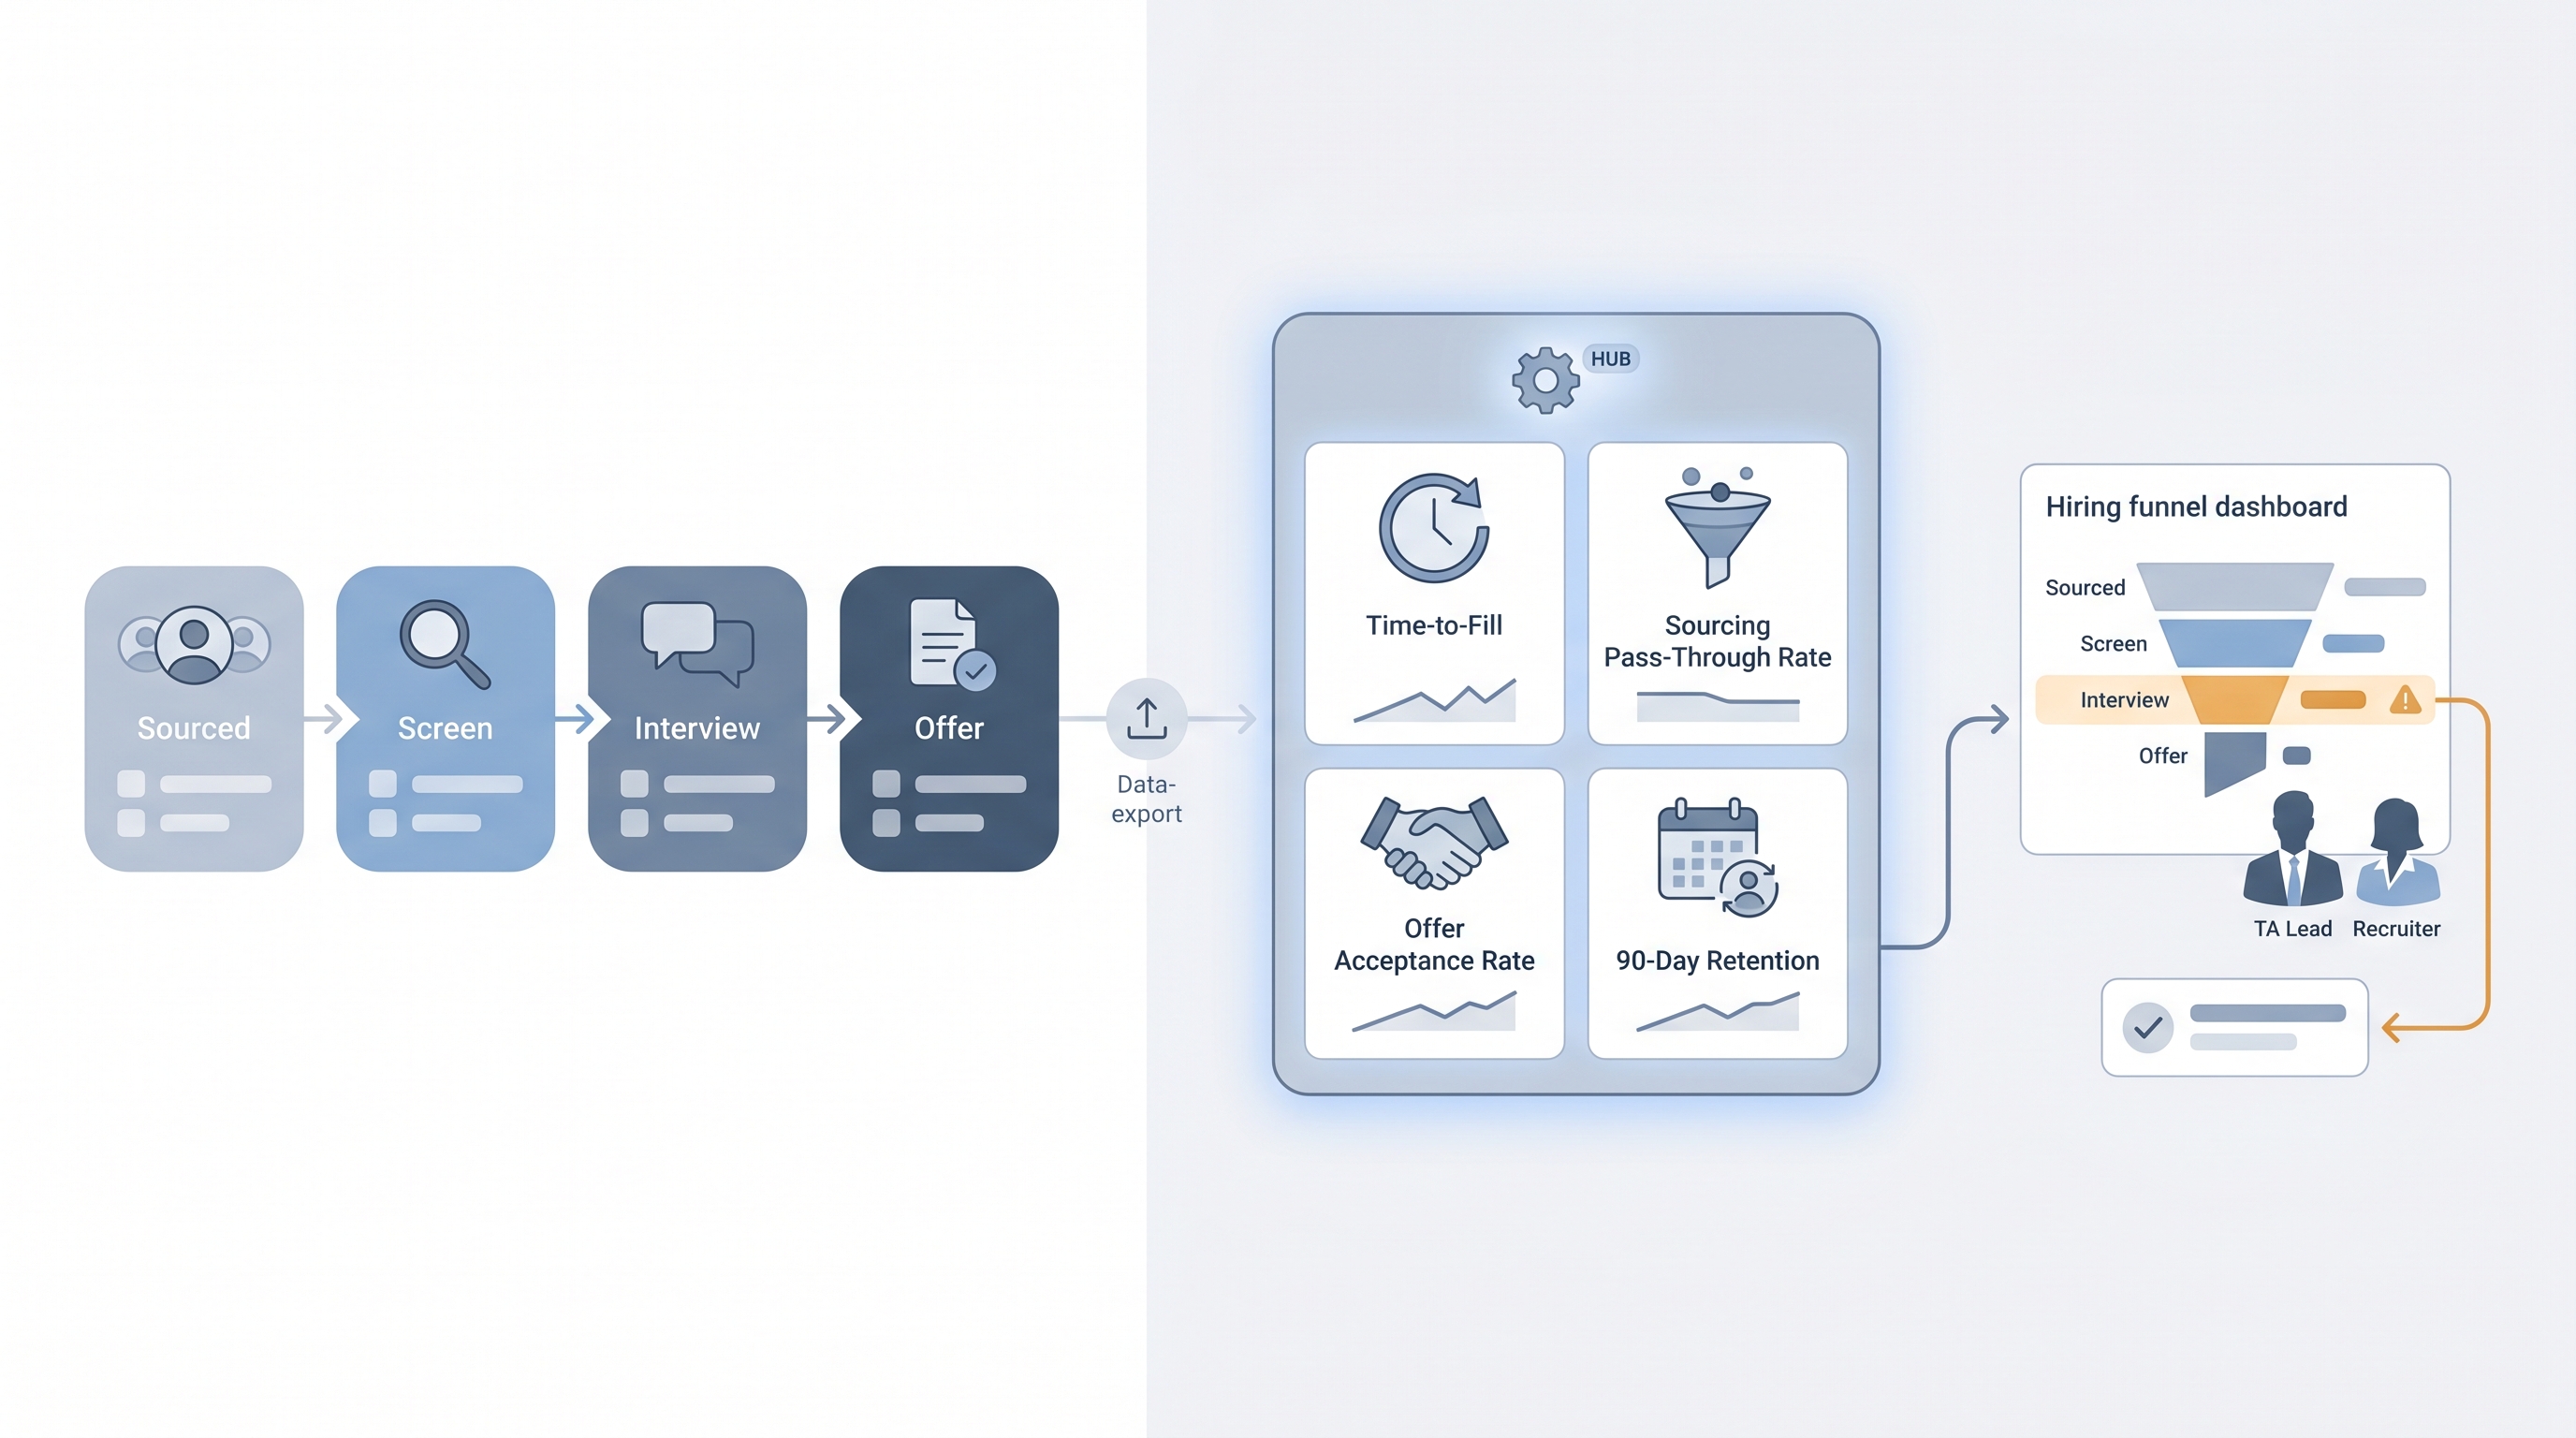
The practice of collecting, measuring, and interpreting hiring funnel data (time-to-fill, cost-per-hire, sourcing pass-through rate, quality of hire) so talent acquisition teams can defend decisions with evidence rather than instinct.
Michal Juhas · Last reviewed May 10, 2026
What is HR analytics in recruitment?
HR analytics in recruitment means using data collected during the hiring process to improve decisions and outcomes. At its most basic: how long reqs take to fill, which sourcing channels produce candidates who advance, what it costs to hire, and whether new hires stay past 90 days. The goal is to move the TA function from "we feel like the pipeline is healthy" to "here is the data that shows which reqs are stalling and why."
Most teams already have the raw material. The ATS holds application counts, stage timestamps, and disposition codes. HR analytics is the practice of cleaning that data, agreeing on definitions, and connecting the numbers to decisions rather than leaving them in a report nobody opens.
In practice
- A TA lead pulling a weekly report from the ATS and sharing stage conversion rates with hiring managers in their Monday standup is running a basic HR analytics practice, even without dedicated tooling.
- "Quality of hire" is the metric TA leaders most want and least know how to define. In one session, a recruiter tracked it by sending a two-question Google Form to hiring managers at 30 days: "Would you hire this person again? Rate 1 to 5." That was enough to start and surfaced two sourcing channels that consistently produced hires hiring managers rated a 2.
- Sourcing analytics often reveal what no one wants to say in a team review: a channel that looks active by volume is not producing candidates who advance past the first screen. That conversation is easier when the data makes it visible rather than leaving it as a suspicion.
Quick read, then how hiring teams use it
This is for recruiters, sourcers, TA leaders, and HR business partners who need to measure, report, and improve hiring performance. Skim the first section for a shared language you can use in tool evaluations, budget reviews, and debrief conversations. Use the second when you are deciding which metrics to build first and how to act on them.
Plain-language summary
- What it means for you: HR analytics in recruitment is tracking hiring numbers across the funnel: how fast reqs close, how expensive each hire is, where candidates drop off, and which sources produce people who actually get hired and stay. Even a spreadsheet with five columns counts as an analytics practice if someone acts on it each week.
- How you would use it: Pick one question your TA team cannot currently answer from data ("which reqs take the longest to fill by hiring manager?") and build the smallest report that answers it. Then act on it once. That is the start of an analytics practice.
- How to get started: Export your ATS data for the last 90 days. Check whether disposition codes are filled in consistently. Write down your team's definition of time-to-fill in one sentence and confirm everyone agrees. Those three steps surface most of the blockers before you need any tool.
- When it is a good time: After basic ATS hygiene is in place: consistent stage names, filled disposition codes, and active recruiters assigned to reqs. Before leadership starts asking questions in business reviews that you cannot answer from memory.
When you are running live reqs and tools
- What it means for you: Analytics connects the ATS pipeline data to the business question: which req is at risk this week, which sourcing channel is underperforming versus last quarter, what is the offer acceptance rate by req level. Answering those questions from data rather than memory changes how TA leaders are perceived in planning cycles and headcount conversations.
- When it is a good time: When you have clean enough ATS data that aggregating it does not produce obviously wrong numbers, and when you have a named owner for acting on each metric rather than just viewing it in a dashboard.
- How to use it: Build a small set of agreed definitions (time-to-fill, sourcing pass-through rate, offer acceptance rate) before building dashboards. Use talent acquisition metrics as the reference for what TA typically tracks. Layer AI analysis on top of clean data, not raw ATS exports with missing fields.
- How to get started: Start with the weekly hiring funnel report format: a few key numbers, stage-by-stage, with one named action per bottleneck. Expand the metric set only after the team is using the first report to make actual decisions rather than filing it as a PDF.
- What to watch for: Dashboard proliferation where reports get built but nobody acts on the findings. GDPR exposure if individual candidate records flow into analytics tools without a documented retention schedule. AI-generated pattern detection that overstates trends in sparse data: fewer than 20 hires per quarter is often too thin for reliable signal.
Where we talk about this
On AI with Michal live sessions the AI in recruiting track covers building your first hiring funnel report, defining a defensible metrics set, and using AI to surface anomalies without creating compliance risk. The sourcing automation track goes deeper on connecting ATS data exports to downstream analytics via API and webhooks. Bring your ATS name and the two metrics your TA leader reports monthly so feedback is grounded in your real stack, not a demo environment. Start at Sourcing Lab.
Around the web (opinions and rabbit holes)
Third-party creators move fast and tooling changes monthly. Treat these as starting points, not endorsements.
YouTube
- Search "recruiting analytics dashboard tutorial" filtered to the last 12 months for practitioners building real ATS reports rather than vendor-sponsored demos. The failure stories, where the dashboard was built and nobody used it, are more useful than the success cases.
- Search "people analytics for talent acquisition" for the broader TA ops perspective that includes workforce planning and retention metrics alongside hiring pipeline data.
- r/humanresources has candid threads on which recruiting metrics actually land with CFOs and which get politely ignored in budget reviews.
- r/recruiting includes sourcers and full-cycle recruiters sharing what their companies actually track versus what leadership says it cares about.
- r/PeopleAnalytics is worth a look if you are building toward a more formal HR analytics practice that spans beyond the recruiting funnel.
Quora
- What metrics should HR use to measure recruitment effectiveness? collects varied practitioner answers across company sizes and industries.
HR analytics metrics at a glance
| Metric | What it measures | Typical owner |
|---|---|---|
| Time-to-fill | Days from req open to offer accepted | TA lead |
| Sourcing pass-through rate | Sourced profiles advancing to first screen | Sourcer |
| Offer acceptance rate | Offers accepted as a share of offers made | Full-cycle recruiter |
| Cost-per-hire | Total recruiting spend divided by hires | TA ops or finance |
| 90-day retention | New hires still employed at day 90 | HRIS or HR ops |
| Diversity funnel metrics | Group representation at each hiring stage | TA lead or DEI partner |
Related on this site
- Glossary: Talent acquisition metrics, Sourcing funnel metrics, Time-to-fill, Sourcing pass-through rate, Recruiter activity reporting, Weekly hiring funnel report, Diversity funnel metrics, Hiring funnel conversion rates, Workflow automation
- Blog: AI sourcing tools for recruiters
- Live cohort: Sourcing Lab
- Membership: Become a member
- Course: Starting with AI: foundations in recruiting