Recruitment analytics tools
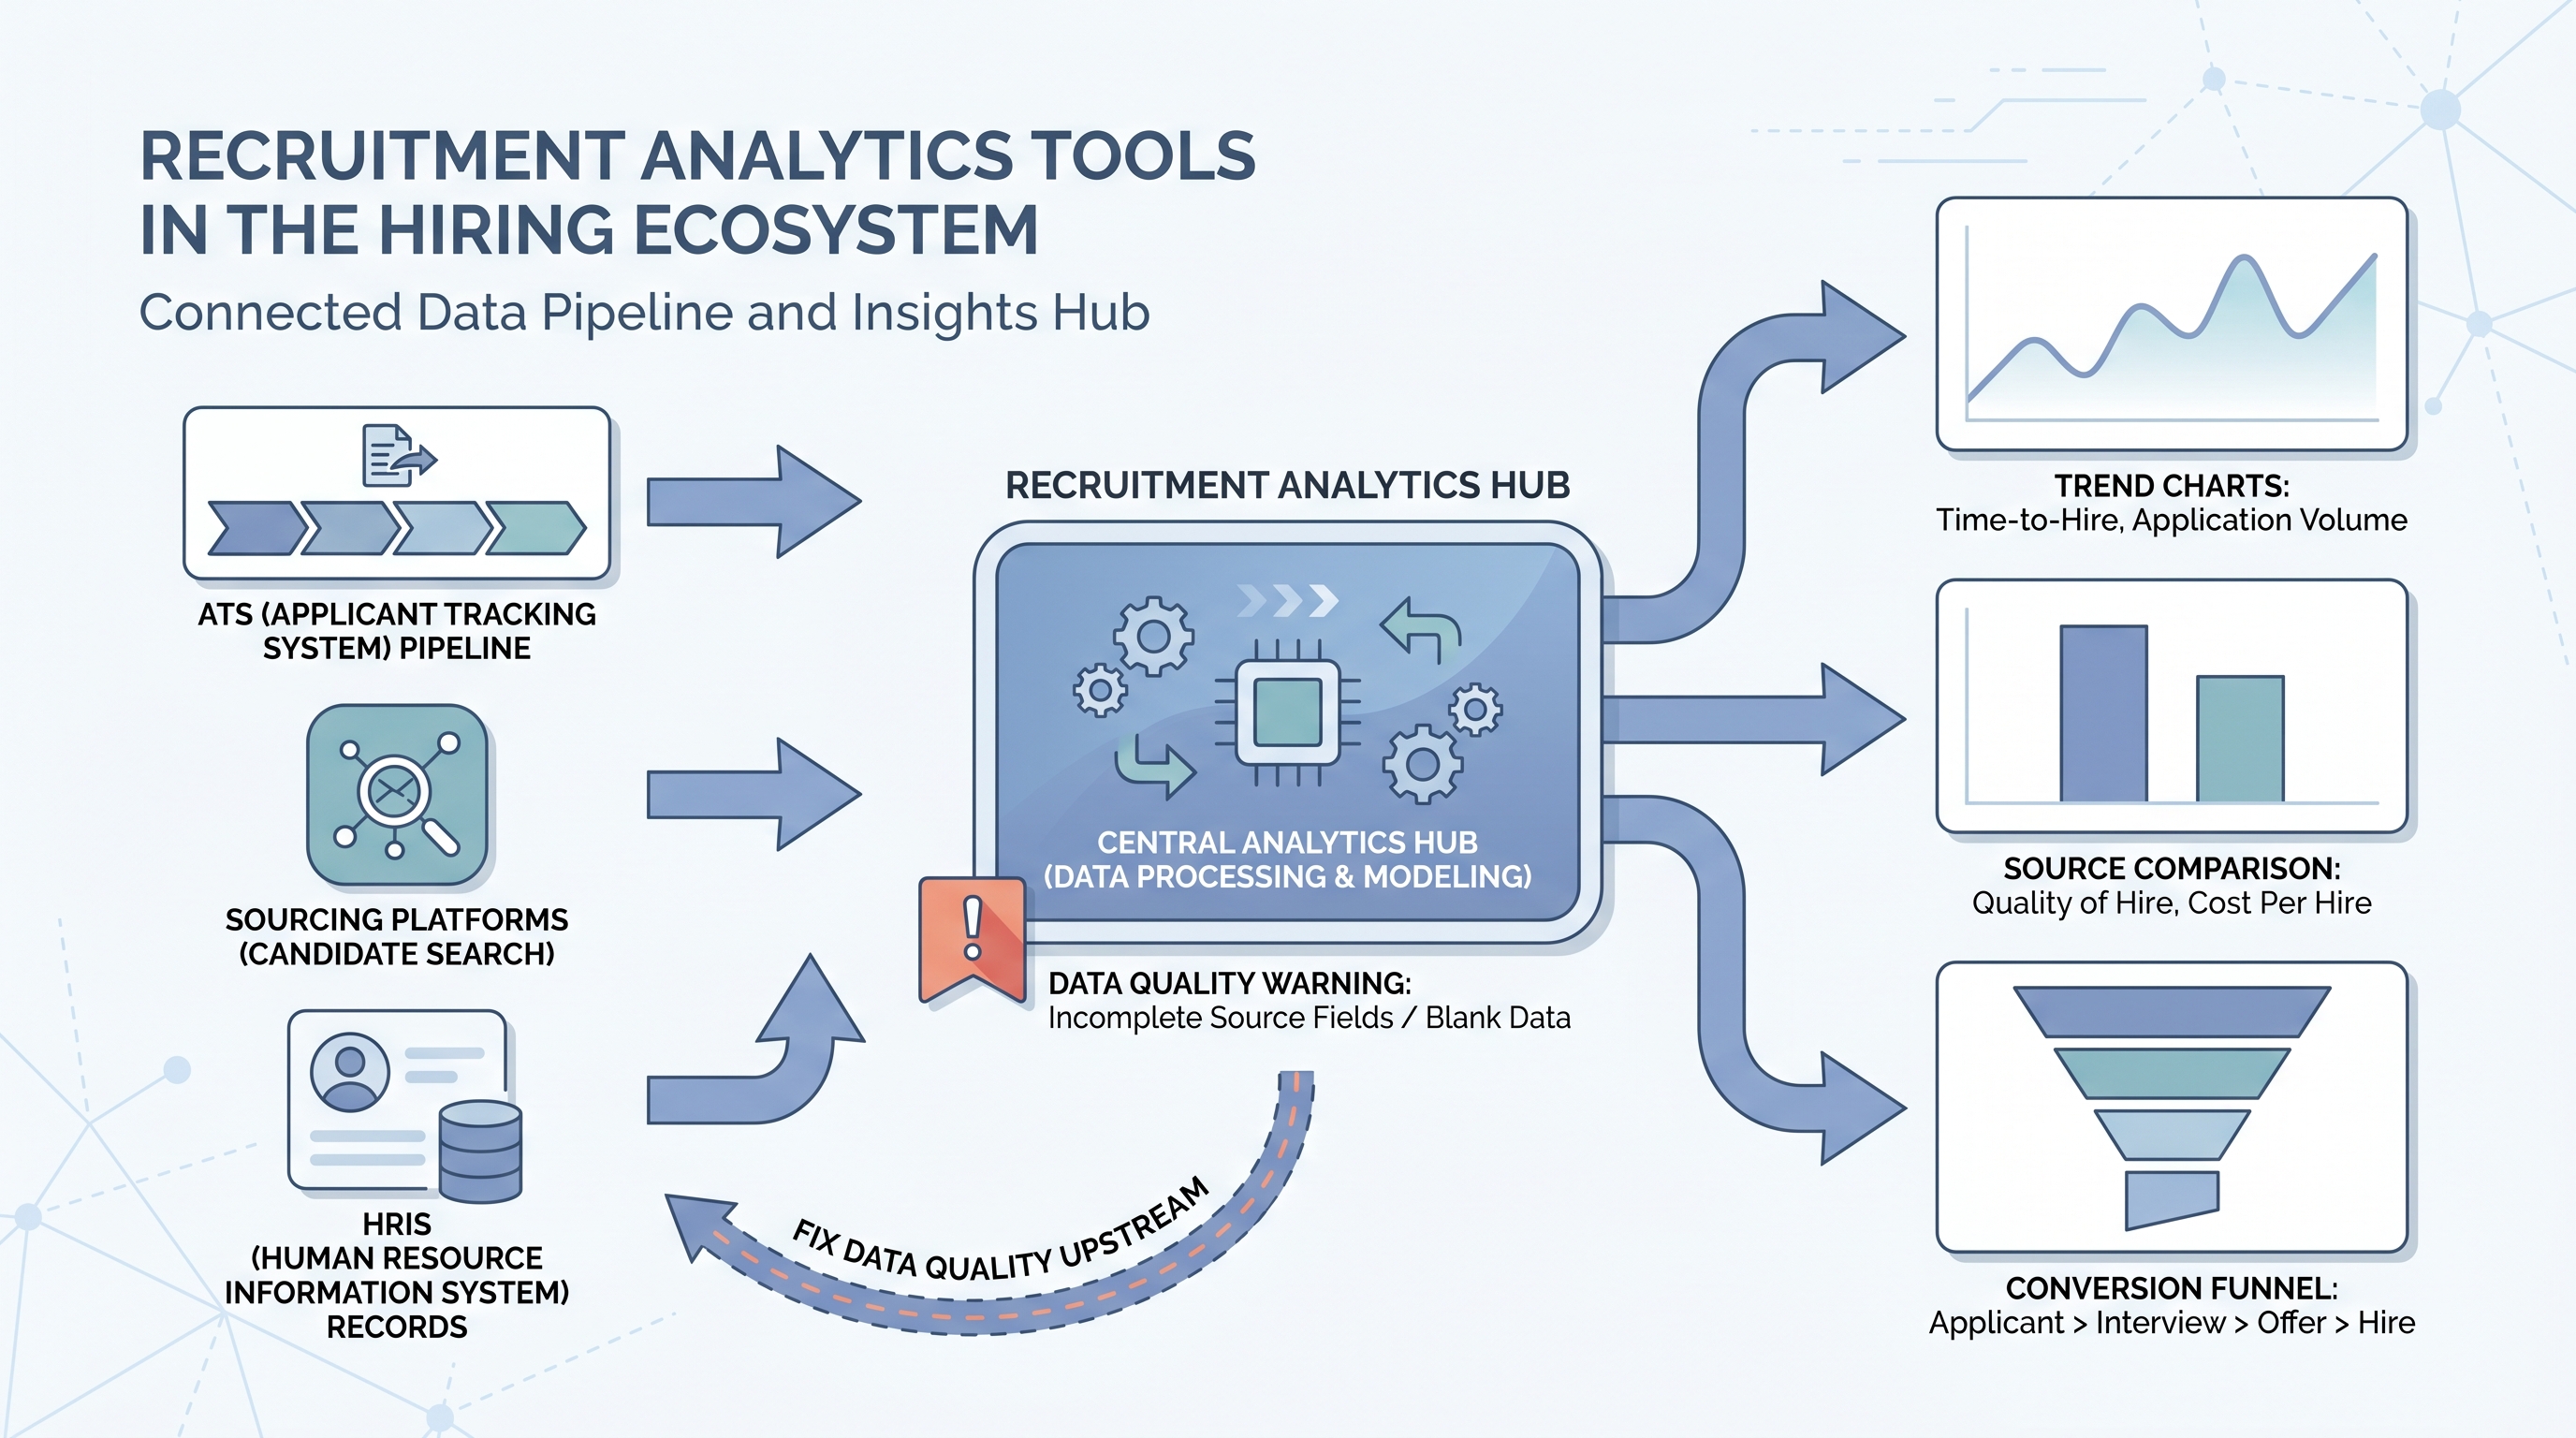
Software platforms that collect, aggregate, and visualize hiring data from your ATS, sourcing systems, and HRIS so TA teams can track pipeline health, stage conversion rates, and source effectiveness without building reports from scratch.
Michal Juhas · Last reviewed May 15, 2026
What are recruitment analytics tools?
Recruitment analytics tools are platforms that pull data from your ATS, sourcing systems, and HRIS and turn it into charts, dashboards, and trend reports your TA team can act on. The category spans lightweight built-in ATS reporting, dedicated BI connectors, and purpose-built platforms that join hiring data with business outcomes like 90-day retention.
The thing most vendors skip in their demos: tool output is only as good as ATS data quality. If your source fields are 40 percent blank, every source-of-hire chart is fiction, no matter how well-designed the platform. Most teams spend more time cleaning data than configuring dashboards once they start using analytics tools seriously.
In practice
- A TA ops manager evaluating analytics tools asks the vendor one question before the demo: can you show me how a blank source field in the ATS appears in your source-of-hire report? Vendors who dodge the question get removed from the shortlist.
- A recruiter hears "we need a Greenhouse dashboard" in a team meeting and pushes back: before adding another tool, fix how we are logging source fields. The analytics platform cannot repair what the process is not capturing.
- "We use ATS reporting for this" is the most common answer at small and mid-size TA teams, until a leadership request arrives that requires a year-over-year comparison across three hiring cycles. At that point the export takes four hours and three manual joins.
Quick read, then how hiring teams use it
This is for recruiters, sourcers, TA, and HR partners who need the same vocabulary in debriefs, vendor calls, and budget reviews. Skim the first section when you need a fast shared picture. Use the second when you are deciding how analytics tools show up in your ATS configuration, sourcing stack, or leadership reporting.
Plain-language summary
- What it means for you: Recruitment analytics tools are the layer between your raw ATS data and the chart your VP asks to see on Friday. They save you from exporting CSVs and doing the math yourself.
- How you would use it: Connect the tool to your ATS, agree on five metrics your team will review weekly, and configure one owner and one threshold per metric before you build any views.
- How to get started: Pull time-to-fill and offer acceptance rate from your current ATS for the last six months, broken down by team. The outlier team is where your first useful analysis already lives, before you buy anything.
- When it is a good time: Before a headcount review or tool-spend audit, and whenever leadership starts asking questions you cannot answer from standard ATS exports.
When you are running live reqs and tools
- What it means for you: An analytics layer only earns trust if the data feeding it is clean. Your first project with any analytics tool should be an audit of which ATS fields are consistently populated and which are not.
- When it is a good time: When your team runs more than ten open reqs simultaneously and pipeline reviews are taking longer to prepare than to run.
- How to use it: Start with three panels: stage conversion rates, time-to-fill by team, and source of hire by interview rate (not application count). Add panels only after you have acted on those three for a full quarter.
- How to get started: Before evaluating tools, document which ATS fields you actually need, which APIs your ATS exposes, and who will own the integration when something breaks. The tool decision follows the data audit, not the other way around.
- What to watch for: Integration drift, where the tool silently stops syncing after an ATS update. Set a weekly check that counts records imported that day. If the number drops to zero, your dashboard is serving last month's data. See recruiting webhooks for how real-time triggers reduce this risk.
Where we talk about this
AI with Michal Sourcing Lab covers recruitment analytics tools in the context of AI-assisted recruiting: which numbers to feed into model prompts, how to structure ATS exports for automated analysis, and when AI-generated pipeline insights are trustworthy versus when they are working from inconsistent input. The sourcing automation track covers data hygiene as a prerequisite before automation makes any pipeline signal reliable.
Around the web (opinions and rabbit holes)
Third-party creators move fast. Treat these as starting points, not endorsements, and double-check anything before you wire candidate data.
YouTube
- Recruiting Metrics and Analytics Tools (YouTube search) surfaces practitioner walkthroughs from AIHR and Recruiting Daily on ATS analytics configurations, dashboard setup, and how TA teams structure weekly metric reviews.
- HR Analytics Tools Comparison covers how different platforms connect to HRIS and ATS systems, useful for teams building a vendor shortlist before demos.
- How to Track Recruiting Metrics (various) walks through the specific data problems that surface when teams move from ATS-native reports to dedicated analytics tools.
- What analytics tools do you use for recruiting? in r/recruiting has candid threads about which platforms teams actually adopt versus evaluate and drop.
- Source of hire data is unreliable in r/recruiting is an honest conversation about ATS data quality problems that break source attribution before any analytics tool can help.
- TA metrics leadership actually wants in r/humanresources covers the gap between what TA tracks internally and what finance and People leaders ask for in quarterly reviews.
Quora
- What are the best recruiting analytics tools? collects practitioner answers on platform selection across different ATS configurations and team sizes (read critically; vendor bias shows up often).
Analytics tool types compared
| Type | Best for | Limitation |
|---|---|---|
| ATS built-in reports | Fast point-in-time snapshots | No cross-period trend comparison |
| Purpose-built analytics layer | TA teams with multiple data sources | Requires clean ATS input fields |
| BI connector to ATS data | Full control over metric definitions | Needs engineering or ops ownership |
| Manual CSV workflow | Very small teams, one-off reviews | Breaks on any ATS column change |
Related on this site
- Glossary: Recruitment analytics software, Recruitment analytics dashboard, Talent acquisition metrics, Hiring funnel conversion rates, Funnel drop-off analysis, Sourcing funnel metrics
- Blog: How to use AI in recruiting
- Guides: Sourcers, Hiring managers
- Course: Starting with AI: the foundations in recruiting
- Live cohort: Sourcing Lab
- Membership: Become a member