Recruitment analytics software
Platforms and tools that collect, organize, and visualize hiring data so TA teams can measure pipeline health, sourcing effectiveness, and time-to-hire without manually pulling ATS exports.
Michal Juhas · Last reviewed May 9, 2026
What is recruitment analytics software?
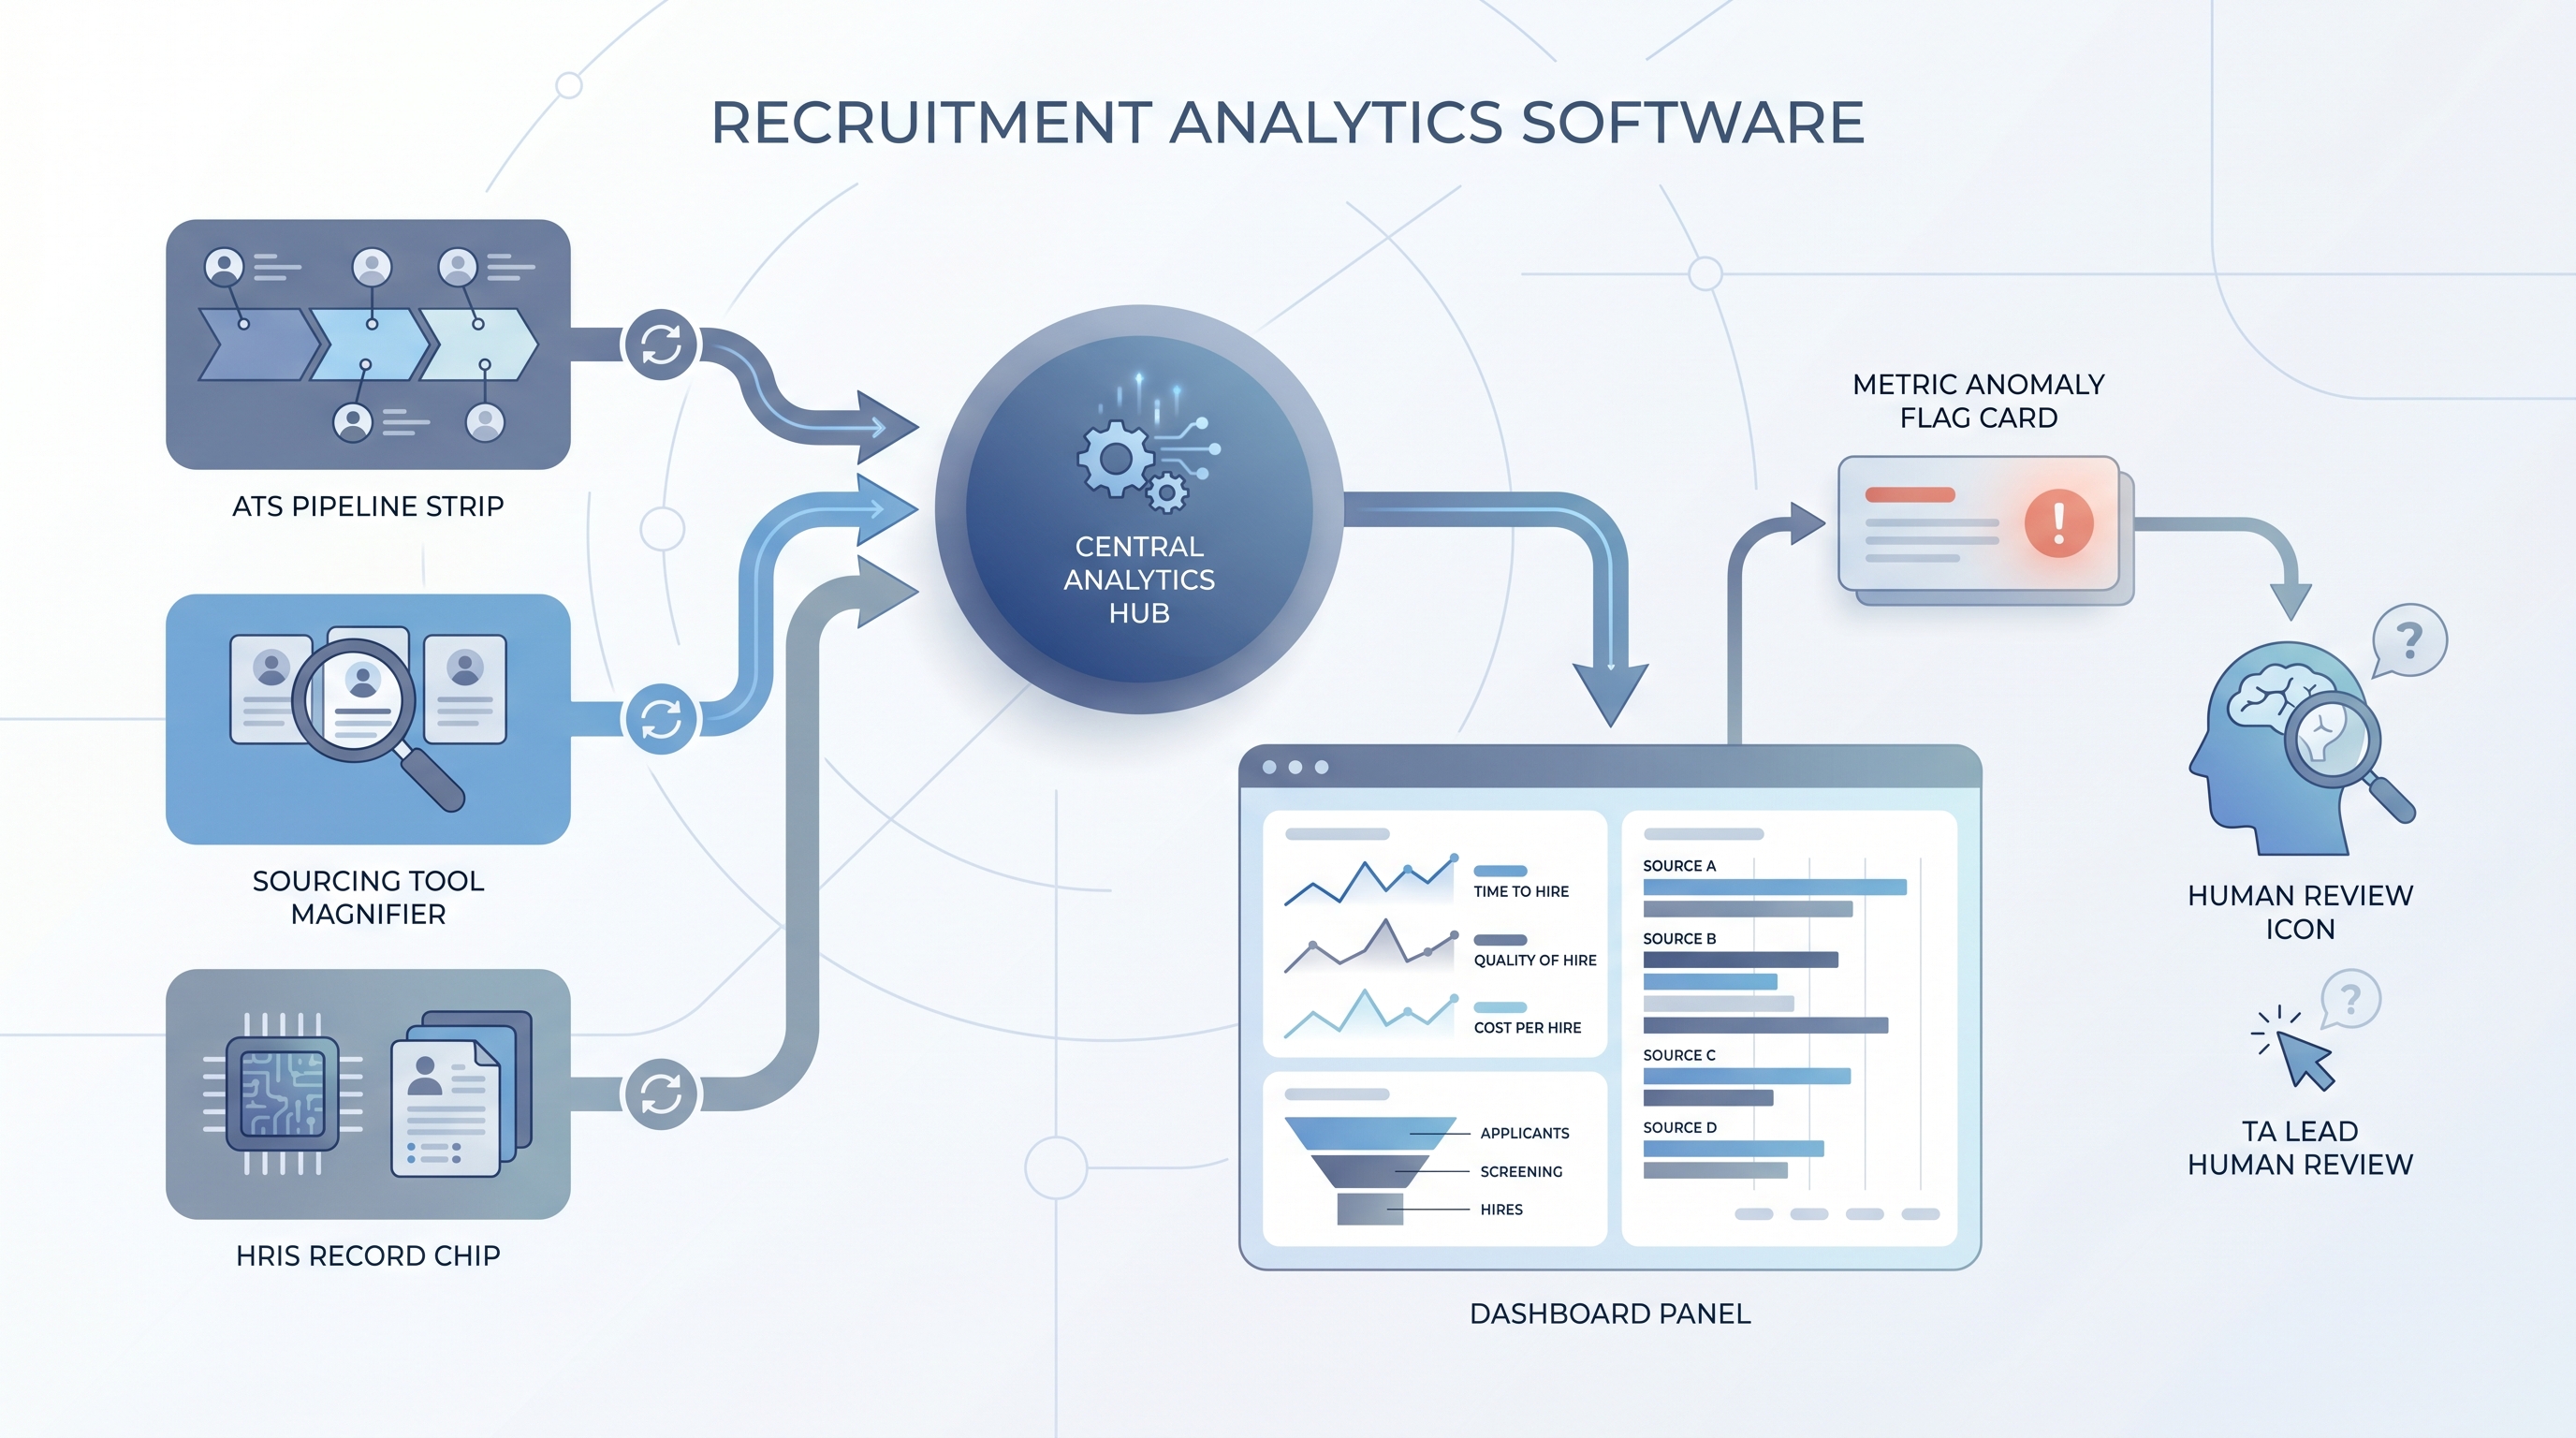
Recruitment analytics software collects hiring data from your ATS, HRIS, and sourcing tools, organizes it into metrics, and presents dashboards so TA teams can make decisions based on pipeline facts rather than gut feel or memory. The category covers single-purpose reporting add-ons, purpose-built TA intelligence platforms, and analytics modules inside a larger HRIS suite.
The distinction that matters in practice: ATS reporting shows you where candidates are right now. Analytics software shows you whether that picture is getting better or worse over time, and which levers moved it.
In practice
- A TA operations lead sets up a weekly dashboard that surfaces time-to-fill by req type, source-of-hire pass rates, and offer acceptance rates. She spends five minutes Monday morning flagging anything that shifted by more than ten percent week over week, then brings two specific questions to the team standup rather than a full metrics review.
- A TA director at a company post-acquisition discovers that two ATS instances produce different field names for the same stage data. The analytics platform they bought cannot normalize the records automatically, so the source-of-hire chart is meaningless until someone manually maps the field definitions. The lesson: ATS data quality is the ceiling for analytics value, no matter how polished the dashboard looks.
- In a vendor call, the phrase "recruitment analytics software" signals that the buyer wants pipeline reporting, source attribution, and time-based trends, not just the raw stage counts the ATS already shows. It is a different buying conversation from "we need an ATS" or "we need sourcing tools."
Quick read, then how hiring teams use it
This is for recruiters, TA leaders, HR partners, and hiring managers who need shared vocabulary when evaluating reporting tools or interpreting dashboards in team reviews. Skim the first section when you need a fast shared picture. Use the second when you are deciding what metrics to wire up and how to use them in practice.
Plain-language summary
- What it means for you: Recruitment analytics software turns ATS stage counts into trend lines, conversion rates, and source comparisons so you can see what is working and what is slowing down without building pivot tables every week.
- How you would use it: Connect the platform to your ATS, set three to five metrics that matter for the current quarter, and review them on a fixed cadence. Flag anomalies; diagnose them outside the dashboard.
- How to get started: Audit your ATS data quality first. If key fields like source of hire and time-in-stage are not filled in consistently, clean those before you trust a dashboard.
- When it is a good time: When the same questions about pipeline health come up in every standup but take thirty minutes to answer, when leadership asks for hiring forecasts and you have no data to back them, or when you are scaling a team and need to identify bottlenecks without interviewing every recruiter individually.
When you are running live reqs and tools
- What it means for you: Analytics software changes how you prioritize recruiter attention across reqs: it tells you which roles are at risk of missing their deadline, which stages are holding candidates longer than the SLA, and which sources consistently deliver qualified candidates versus vanity applications.
- When it is a good time: After the ATS fields that feed your key metrics are being populated consistently. Before that point, the dashboards are accurate but the data is not.
- How to use it: Set metric owners. Assign one person to flag weekly, one to diagnose monthly. Separate the "real time" layer (SLA alerts, req health checks) from the "strategic" layer (cost-per-hire by source, conversion rate trends by role type). Cross-link data with time-to-fill, pipeline coverage reporting, and hiring funnel conversion rates.
- How to get started: Pick one dashboard question that costs you thirty minutes today. Wire the data to answer just that. Expand only after the first answer is trusted and used consistently.
- What to watch for: ATS field drift after a system update breaks metric calculations, sourcing tool integrations that stop sending data silently, and model-driven scores inside the analytics platform that no one can explain when a compliance question arrives. For the explainability requirement, see explainable AI in hiring.
Where we talk about this
On AI with Michal live sessions, recruitment analytics software comes up in both tracks. The AI in recruiting block covers how to set up metrics that actually drive decisions rather than dashboard theater, and what questions to ask before a vendor demo. The sourcing automation block connects sourcing tool data to the reporting layer so source-of-hire becomes a reliable metric rather than a field filled by memory. If you want the live room conversation on which tools held up in production and which required more manual work than they saved, start at Sourcing Lab and bring your current reporting pain points.
Around the web (opinions and rabbit holes)
Third-party creators move fast. Treat these as starting points, not endorsements, and double-check anything before you connect candidate data to a new platform.
YouTube
- Search "talent acquisition analytics dashboard" to see how TA ops teams build and interpret pipeline reports in practice. Watch for whether the presenter shows data quality setup or jumps straight to insights, a reliable signal of how much work the tool actually saves.
- Search "recruiting metrics that matter" for TA practitioners sharing the five or ten numbers they track and why, including which ones they stopped tracking after realizing they drove no decisions.
- Search "hiring data quality ATS" for content on the upstream problem that makes analytics fail before it starts.
- Search "recruiting analytics tool worth it" in r/TalentAcquisition for post-deployment candor on whether analytics platforms delivered what the demo showed.
- Search "ATS data quality problems" in r/recruiting for the most common field population failures that break downstream reporting.
- Search "TA metrics weekly reporting" in r/TalentAcquisition to see what other teams actually review week to week, which often differs from what vendors suggest you measure.
Quora
- What metrics should a recruiting team track? collects practitioner answers on the reporting layer from people who have built it in different ATS environments.
Analytics software versus ATS built-in reports
| Dimension | ATS built-in reports | Purpose-built analytics |
|---|---|---|
| Data freshness | Real time or daily | Sync schedule (hours or days) |
| Cross-source data | ATS only | ATS plus HRIS, sourcing, surveys |
| Custom metrics | Limited by ATS config | Flexible with SQL or drag-and-drop |
| Historical trends | Varies by ATS | Designed for trend analysis |
| Compliance reporting | Basic (often manual) | Adverse impact, EEO-1 support |
Related on this site
- Glossary: Talent acquisition metrics, Hiring funnel conversion rates, Pipeline coverage reporting, Sourcing funnel metrics, Time-to-fill, Recruiter activity reporting, Diversity funnel metrics, Adverse impact, Explainable AI in hiring, Weekly hiring funnel report
- Blog: AI sourcing tools for recruiters
- Guides: Sourcers
- Live cohort: Sourcing Lab
- Membership: Become a member
- Course: Starting with AI: foundations in recruiting