Cohort hiring funnel analysis
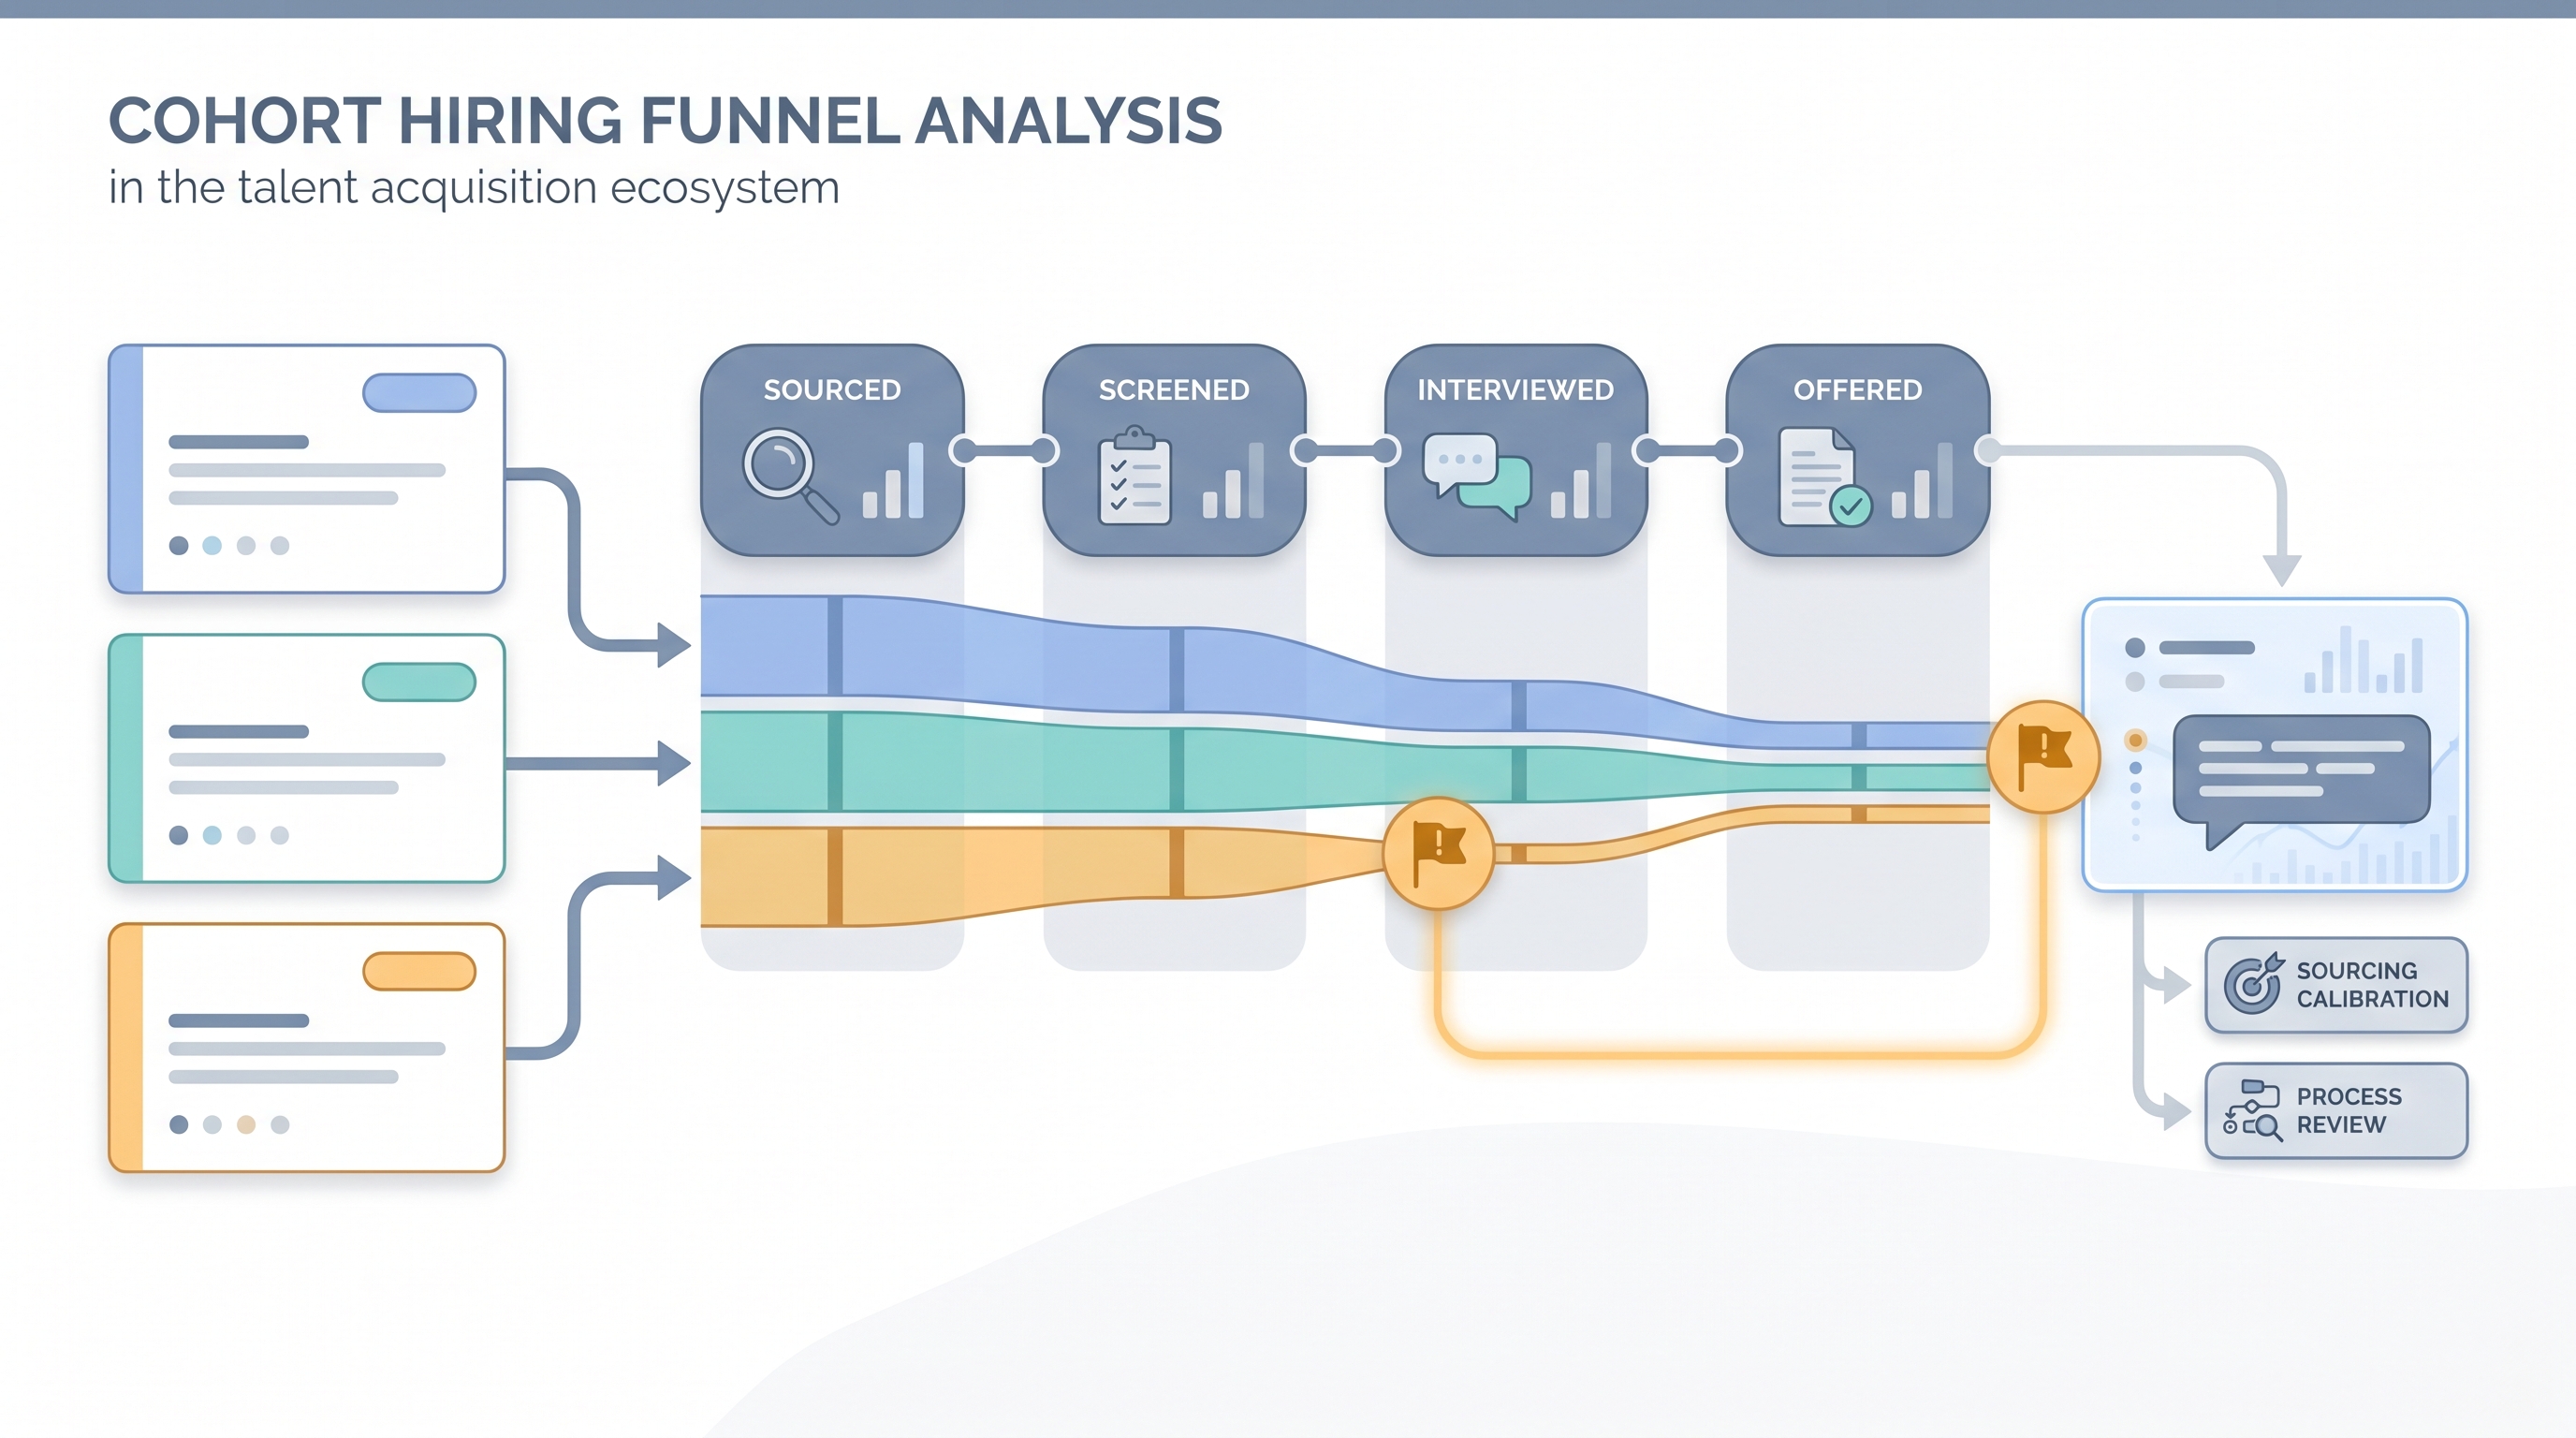
Grouping candidates by a shared attribute, such as hire month, sourcing channel, department, or hiring manager, and comparing how each group moves through the hiring pipeline to reveal patterns that single-req tracking misses.
Michal Juhas · Last reviewed May 9, 2026
What is cohort hiring funnel analysis?
Cohort hiring funnel analysis groups candidates by a shared attribute, such as application month, sourcing channel, department, or hiring manager, and then compares how each group converts at each stage of the pipeline. One req shows you one story; cohort analysis shows you the systemic pattern across dozens of stories at once.
In practice
- A TA ops lead comparing four sourcing channels from the past quarter and noticing that referrals convert from interview to offer at twice the rate of job board applicants is doing cohort hiring funnel analysis, even if they call it a sourcing report.
- When a recruiting team reviews why Q1 hires passed technical screens less often than Q4 hires and traces it to a scorecard change in January, that retrospective is a cohort analysis by hire month.
- Diversity and inclusion teams checking whether underrepresented candidates drop at the same stages as the overall population are running cohort funnel analysis across demographic groups.
Quick read, then how hiring teams use it
This is for recruiters, TA ops leads, sourcers, and HR partners who need the same vocabulary in debrief meetings, quarterly reviews, and vendor evaluations. Skim the first section for a shared picture. Use the second when you are building the analysis inside an ATS or spreadsheet.
Plain-language summary
- What it means for you: Instead of asking "how is hiring going?" in general, you split candidates into groups and ask "how does hiring go differently for each group?" That comparison shows you where to focus improvement.
- How you would use it: Pick one question, such as which sourcing channel produces hires who accept offers, define the cohorts, pull the funnel data for each group, and compare stage by stage.
- How to get started: Export the last 90 days of candidate data from your ATS, add a cohort column for the attribute you care about, build a pivot table with stage counts per cohort, and calculate conversion rates at each step.
- When it is a good time: After you have at least 30 candidates per cohort, when preparing a quarterly sourcing review, or when leadership asks why time-to-fill changed from the previous period.
When you are running live reqs and tools
- What it means for you: Cohort analysis makes the difference between reacting to this week's numbers and understanding which structural patterns drive them.
- When it is a good time: Quarterly at minimum, or whenever a stage conversion rate drops more than 10 percentage points below your baseline. Use it before renewing a sourcing vendor contract or adjusting an applicant tracking software workflow.
- How to use it: Tag candidates with cohort attributes at entry: source, req type, department, hiring manager. Ensure consistent stage names across reqs. Run sourcing funnel metrics alongside conversion rates so you see both volume and quality signals together.
- How to get started: Define the cohort attribute and time window before pulling data. Clean stage hygiene first: skipped stages or missing disposition codes will skew every rate. Pull the same metrics for each cohort in parallel so comparisons are honest.
- What to watch for: Small cohort sizes that make rates statistically unreliable, post-hoc cohort definition that looks like cherry-picking, denominator shifts from sourcing volume changes, and ATS stage hygiene gaps that make one cohort appear to convert better because a recruiter skipped a stage.
Where we talk about this
On AI with Michal live sessions, the sourcing automation and AI in recruiting tracks both include time on interpreting funnel data by cohort. We walk through ATS exports, live pivot analyses, and how to present cohort findings to hiring managers and finance without overstating what the data shows. If you want the full room conversation, not only this page, start at Sourcing Lab and bring your own ATS export and a specific question.
Around the web (opinions and rabbit holes)
Third-party creators move fast. Treat these as starting points, not endorsements, and double-check anything before you wire candidate data into a new system.
YouTube
- Search "recruiting funnel analysis" or "ATS cohort reporting" on YouTube for practitioner walkthroughs of pivot table setups and conversion dashboards shared openly by TA ops teams.
- Channels covering TA metrics and people analytics in plain language are good starting points before you go deeper into tooling choices.
- r/recruiting threads on reporting and metrics surface real practitioner debates about what conversion benchmarks actually mean versus what vendors claim.
- r/humanresources has recurring discussions on ATS reporting gaps and why stage hygiene is harder than most vendors admit in demos.
Quora
- Search "recruiting pipeline cohort analysis" on Quora for a range of practitioner perspectives from both in-house TA and agency-side recruiters (quality varies; read critically and verify before acting).
Cohort analysis versus aggregate funnel reporting
| Dimension | Aggregate report | Cohort analysis |
|---|---|---|
| Unit of analysis | All candidates, one period | Defined group sharing one attribute |
| Best for | Weekly status updates | Root cause, sourcing ROI, equity review |
| Risk | Hides which segment drives the trend | Small cohorts produce unreliable rates |
| Data requirement | Stage counts and timestamps | Consistent cohort tagging at entry |
Related on this site
- Glossary: Hiring funnel conversion rates, Sourcing funnel metrics, Diversity funnel metrics, Adverse impact, Talent acquisition metrics, Time to fill
- Glossary: Stage conversion hiring funnel, Funnel drop-off analysis, Weekly hiring funnel report, Scorecard, Applicant tracking software
- Live cohort: Sourcing Lab
- Membership: Become a member