Recruitment and selection analytics
The practice of measuring both pipeline health (sourcing, applications, stage conversion) and selection quality (assessment validity, interview consistency, offer outcomes) so TA teams can trace whether the people they chose actually performed as predicted.
Michal Juhas · Last reviewed May 15, 2026
What is recruitment and selection analytics?
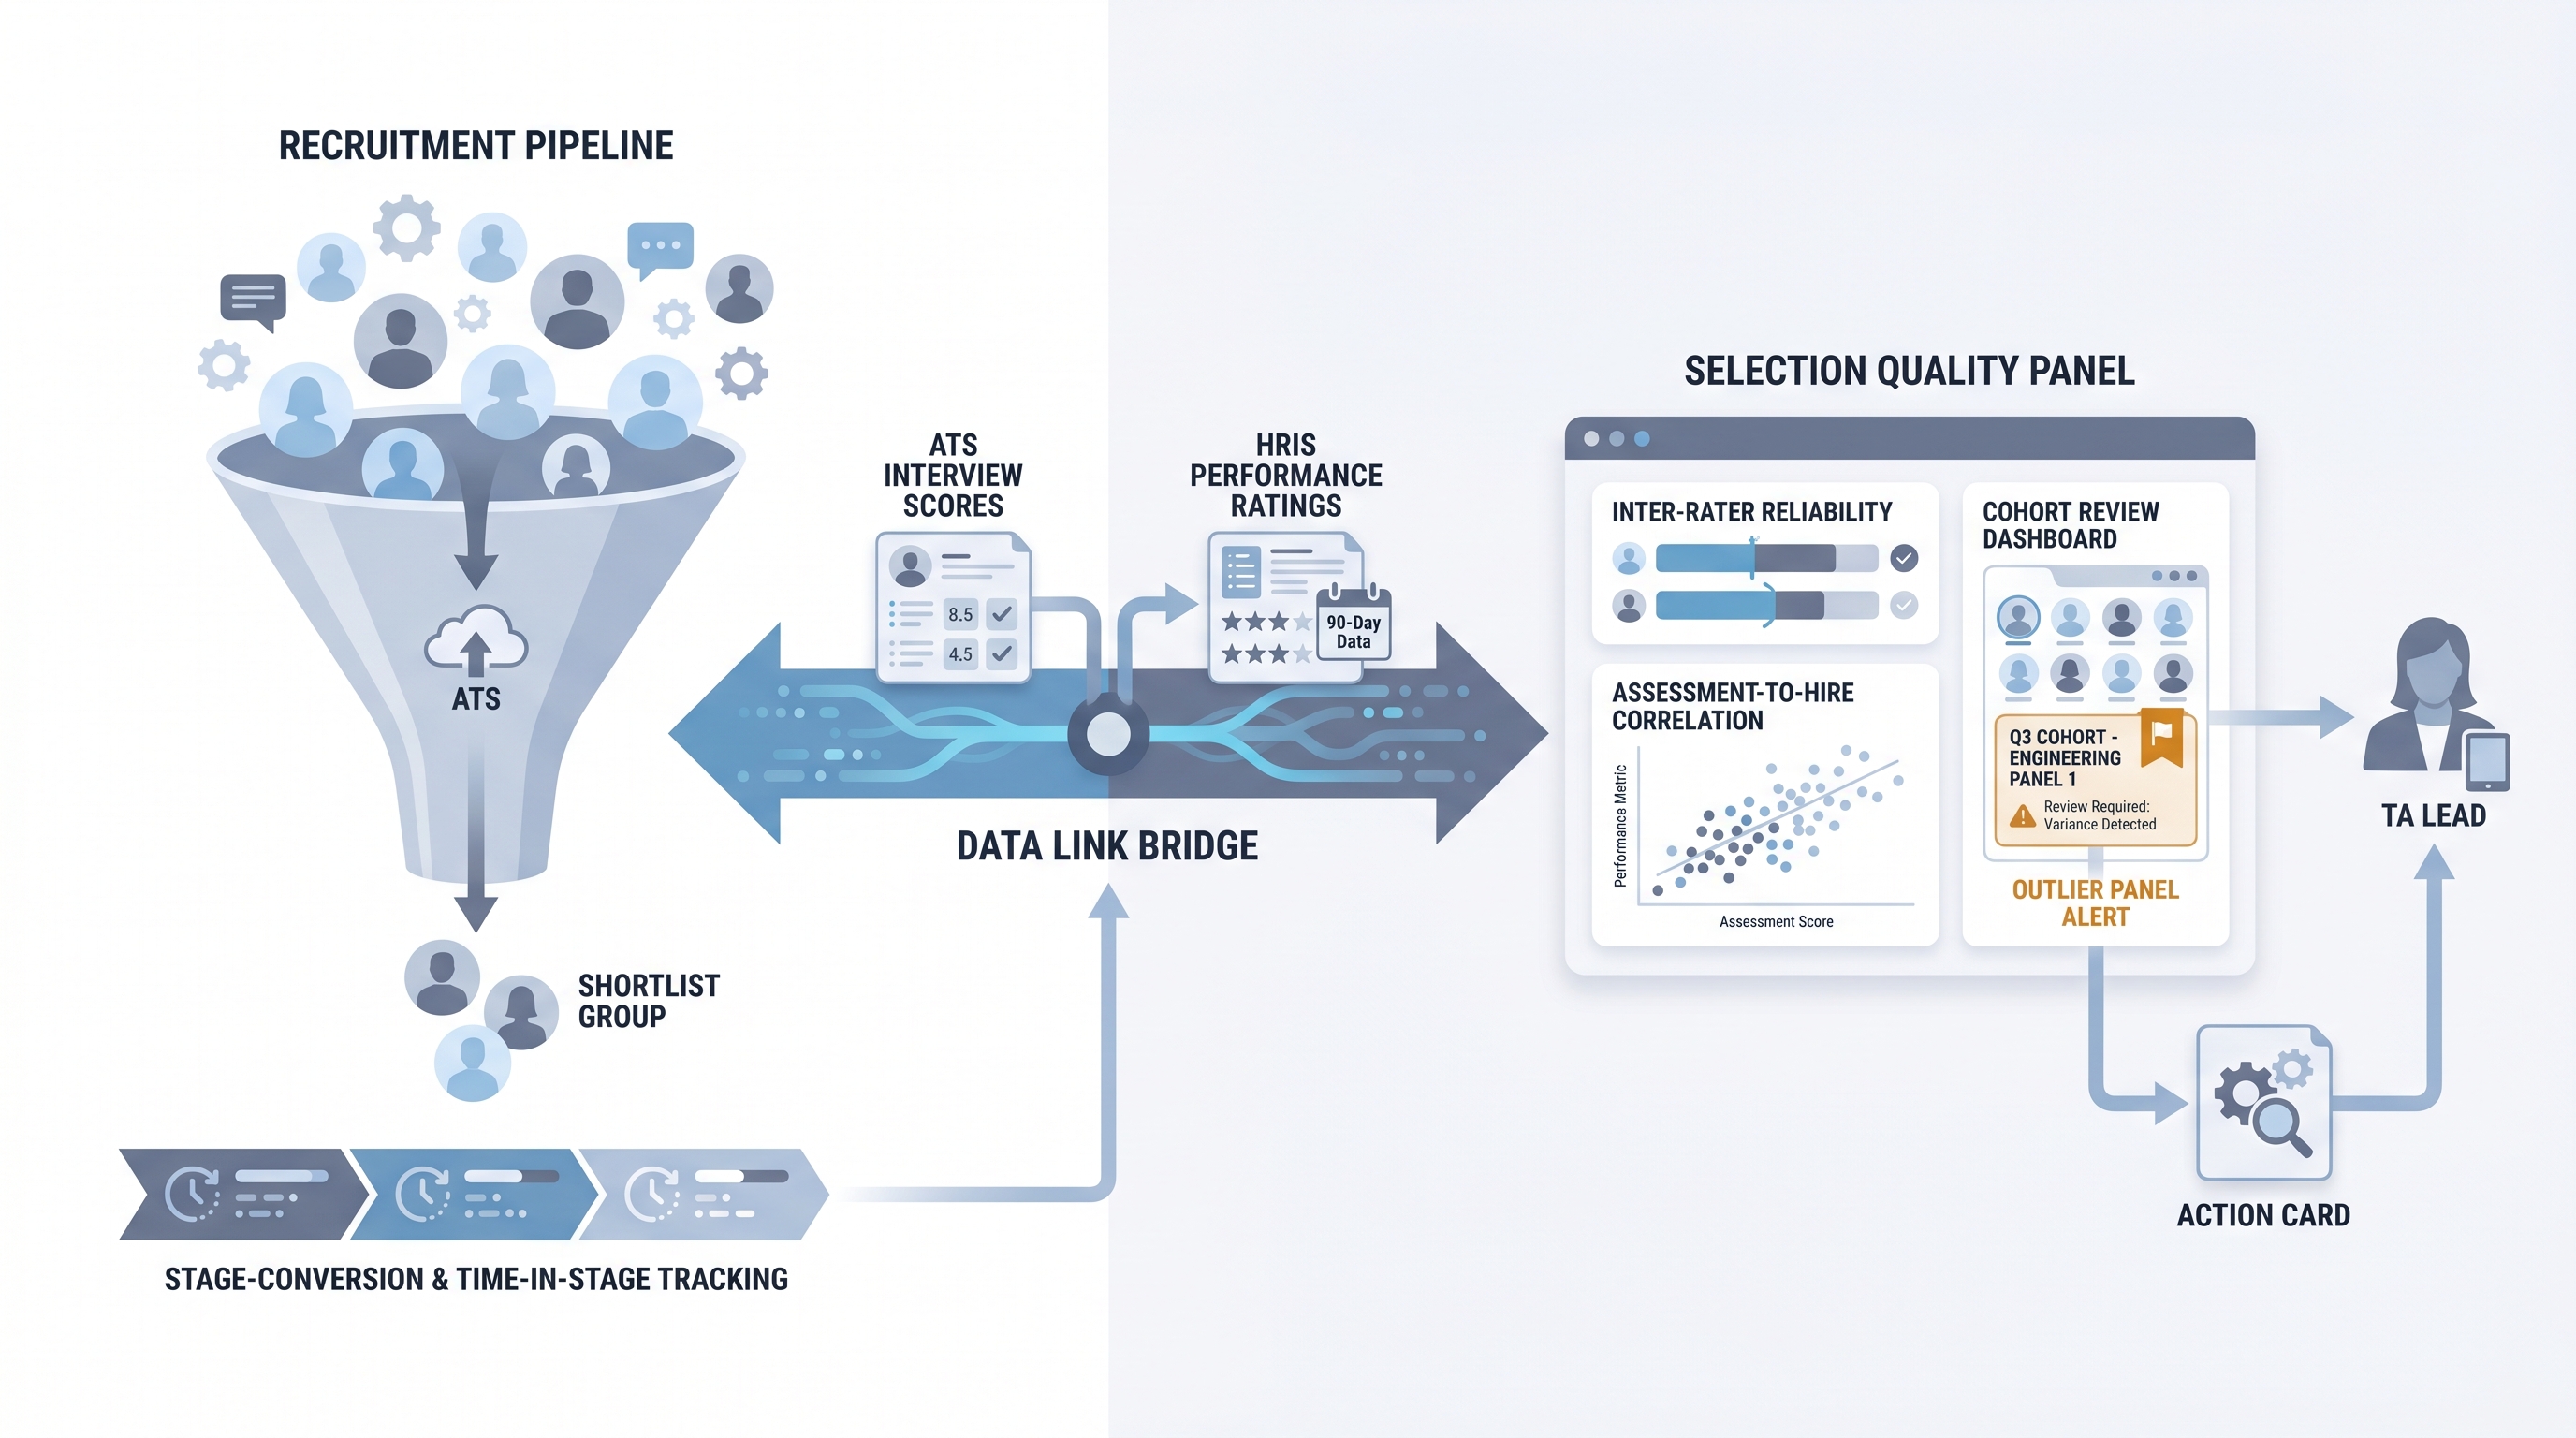
Recruitment and selection analytics covers two distinct but connected measurement practices. The recruitment half tracks the funnel: where candidates come from, how many move through each stage, how long things take, and where the pipeline breaks. The selection half tracks the decision quality: whether the people chosen through interviews and assessments turn out to perform well once hired.
Most TA teams have the first half inside their ATS. The second half requires linking ATS outcomes to HRIS performance data, which is why selection analytics stays underdeveloped even at teams that run mature pipeline dashboards. The gap matters because it is entirely possible to have a fast, efficient recruiting funnel that consistently selects the wrong people.
In practice
- A TA ops lead runs a quarterly cohort review: she pulls interview scores from the ATS for everyone hired in Q1, joins them to 90-day manager ratings from the HRIS, and finds that candidates scored highest by one specific interviewer have consistently lower manager satisfaction scores. The panel calibration conversation that follows changes how that interviewer scores technical competency.
- A recruiter notices that offer acceptance rate for a specific hiring manager is 54 percent compared to a team average of 78 percent. That is a selection analytics finding, not a sourcing one. The conversation that follows is about closing skills and compensation framing, not pipeline volume.
- "We run analytics" often means the team has a time-to-fill dashboard and a source-of-hire chart. Selection analytics starts when someone asks whether the people at the top of the interview scoreboard are the ones who succeeded six months later.
Quick read, then how hiring teams use it
This is for recruiters, sourcers, TA leaders, and HR partners who need the same vocabulary in debrief conversations, tool evaluations, and reporting to People leadership. Skim the first section for a fast shared picture. Use the second when you are deciding what data to capture, what to join, and what to bring to a leadership review.
Plain-language summary
- What it means for you: Recruitment analytics measures whether your funnel is working. Selection analytics measures whether your decisions are working. You need both to know if your hiring process is actually good or just fast.
- How you would use it: Pick one role family where you have structured interview scores stored in the ATS. Pull 90-day manager ratings from the HRIS for everyone hired in that role over the last six months. Ask whether the interview scores predicted the ratings.
- How to get started: Before you build a dashboard, check two things: are interview scores actually stored in your ATS (not just text notes), and does your HRIS have a 90-day review field that is populated consistently? If either is missing, fix the data source before building the analysis.
- When it is a good time: When leadership asks whether your hiring process is improving quality of hire, and you want an answer grounded in data rather than anecdote.
When you are running live reqs and tools
- What it means for you: Selection analytics requires a data join your current tooling may not support out of the box. Plan which system holds interview scores, which holds post-hire performance ratings, and how candidate IDs map between them before you commit to a reporting cadence you cannot deliver.
- When it is a good time: After you have structured scoring in place for at least one role family and a quarterly cohort large enough to show patterns (typically at least 20 hires).
- How to use it: Start with inter-rater reliability as the first selection metric: pull the last three months of structured panel scores for the same competency and check whether two panelists ever scored the same candidate more than one full level apart. That single check tells you whether your selection data is worth analysing further.
- How to get started: Document the data join you need: ATS candidate ID, interview score by competency, offer accepted or declined, HRIS employee ID, 90-day manager rating. Then find out who owns access to both systems and whether a join is technically possible without violating data segmentation rules. See recruiting webhooks for how real-time data triggers between ATS and HRIS can keep the join current without manual exports.
- What to watch for: Small cohort sizes producing misleading correlations, ATS score fields that are filled in for some roles and blank for others, and HRIS performance data that uses a different employee identifier than the ATS candidate ID. Each of these silently breaks the analysis while the charts still render. See funnel drop-off analysis for how to diagnose what is breaking upstream.
Where we talk about this
AI with Michal Sourcing Lab covers recruitment and selection analytics in the AI in recruiting track: which ATS fields to structure for downstream analysis, how to use AI-assisted interview summaries to produce scoreable data from unstructured notes, and what the cohort review conversation with a People leader actually sounds like. The sourcing automation track covers the data infrastructure that makes analytics trustworthy rather than decorative.
Around the web (opinions and rabbit holes)
Third-party creators move fast. Treat these as starting points, not endorsements, and double-check anything before you wire candidate data.
YouTube
- Talent Analytics and Predictive Hiring (YouTube search) surfaces AIHR and LinkedIn Talent Solutions content on linking selection outcomes to post-hire performance, useful for TA teams starting the quality-of-hire conversation with leadership.
- How to Measure Quality of Hire covers practical approaches to the ATS-to-HRIS data join and which metrics leaders actually track in the first year.
- Structured Interviewing and Selection Science walks through the industrial-organizational psychology side of selection validity in plain language, useful context before presenting inter-rater reliability findings to a skeptical hiring manager.
- Does anyone actually measure quality of hire? in r/humanresources is an honest thread about the gap between what companies say about data-driven hiring and what they actually track.
- How do you track whether your interview process is any good? in r/recruiting has candid practitioner answers about what breaks when teams try to close the loop on selection quality.
- TA metrics that actually show hiring quality in r/humanresources separates the metrics that look good on a slide from the ones that tell you whether the process is working.
Quora
- What are the best metrics for recruitment and selection? collects answers from practitioners and academics (read critically; quality varies significantly and vendor bias appears frequently).
Recruitment analytics versus selection analytics
| Dimension | Recruitment analytics | Selection analytics |
|---|---|---|
| Primary question | Is the funnel working? | Are the decisions working? |
| Data source | ATS pipeline and stage data | ATS scores joined to HRIS performance |
| Key metrics | Time-to-fill, stage conversion, source-of-hire | Inter-rater reliability, assessment-to-hire correlation, quality of hire |
| Review cadence | Weekly or monthly | Quarterly or semi-annual cohort review |
| Who owns it | TA ops or recruiter | TA leader plus People analytics or HRBP |
| Common blocker | Blank source fields in ATS | No structured interview scores or no HRIS join |
Related on this site
- Glossary: Talent acquisition metrics, Recruitment analytics tools, Recruitment analytics dashboard, Scorecard, Interview-to-offer ratio, Hiring funnel conversion rates, Predictive hiring, HR analytics in recruitment
- Blog: How to use AI in recruiting
- Guides: Hiring managers
- Course: Starting with AI: the foundations in recruiting
- Live cohort: Sourcing Lab
- Membership: Become a member